
Data Analysis with Python and Excel
Data Fluency (INFO-I 223) was taught by Dr. Ran Chang in Summer 2023. This course covered data preparation, descriptive statistics, Excel, and Python. Students were introduced to SKLearn datasets during Naive Bayes classifier instruction. Since this accelerated course did not include semester projects, Michael created a Jupyter Notebook that explores the SKLearn California Housing dataset. This page features screenshots from Michael's notebook. The full Python code is viewable on GitHub.
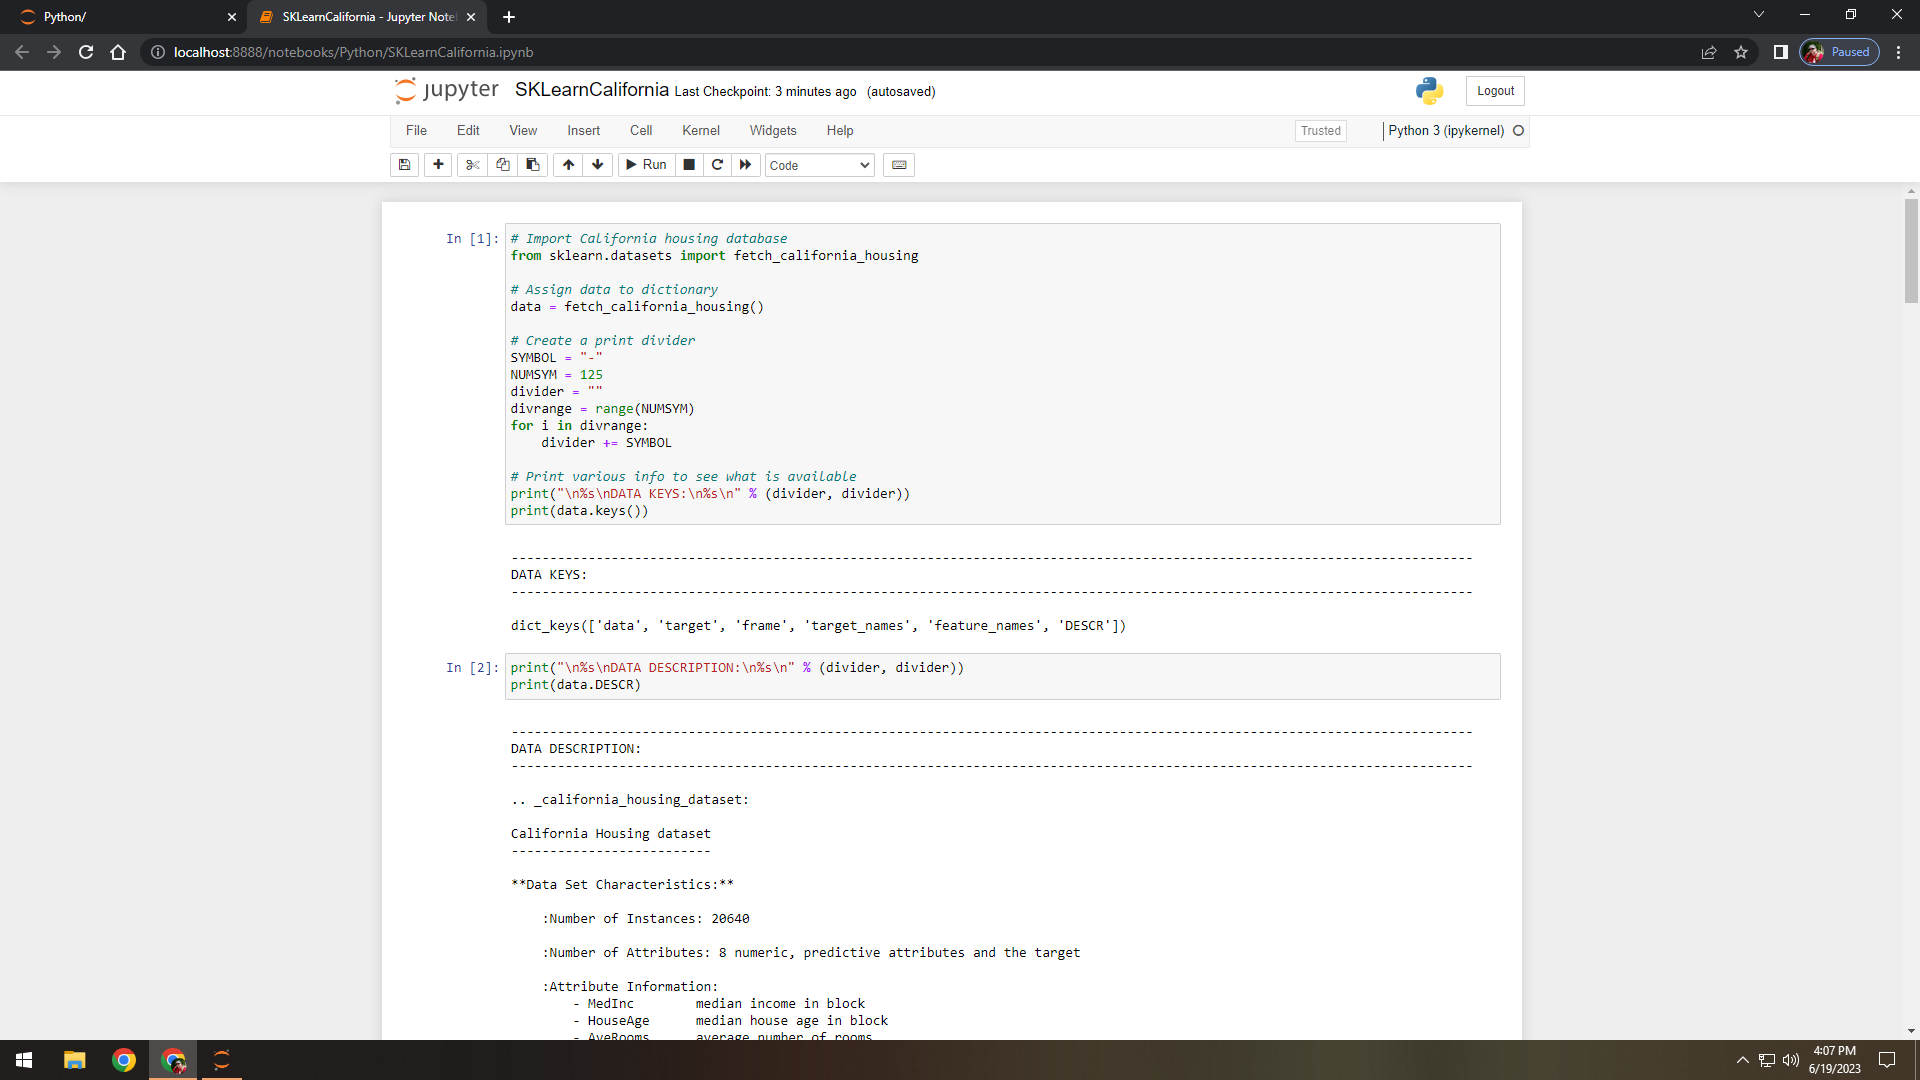
Figure 1. Imported dataset and displayed keys to see what data is available.
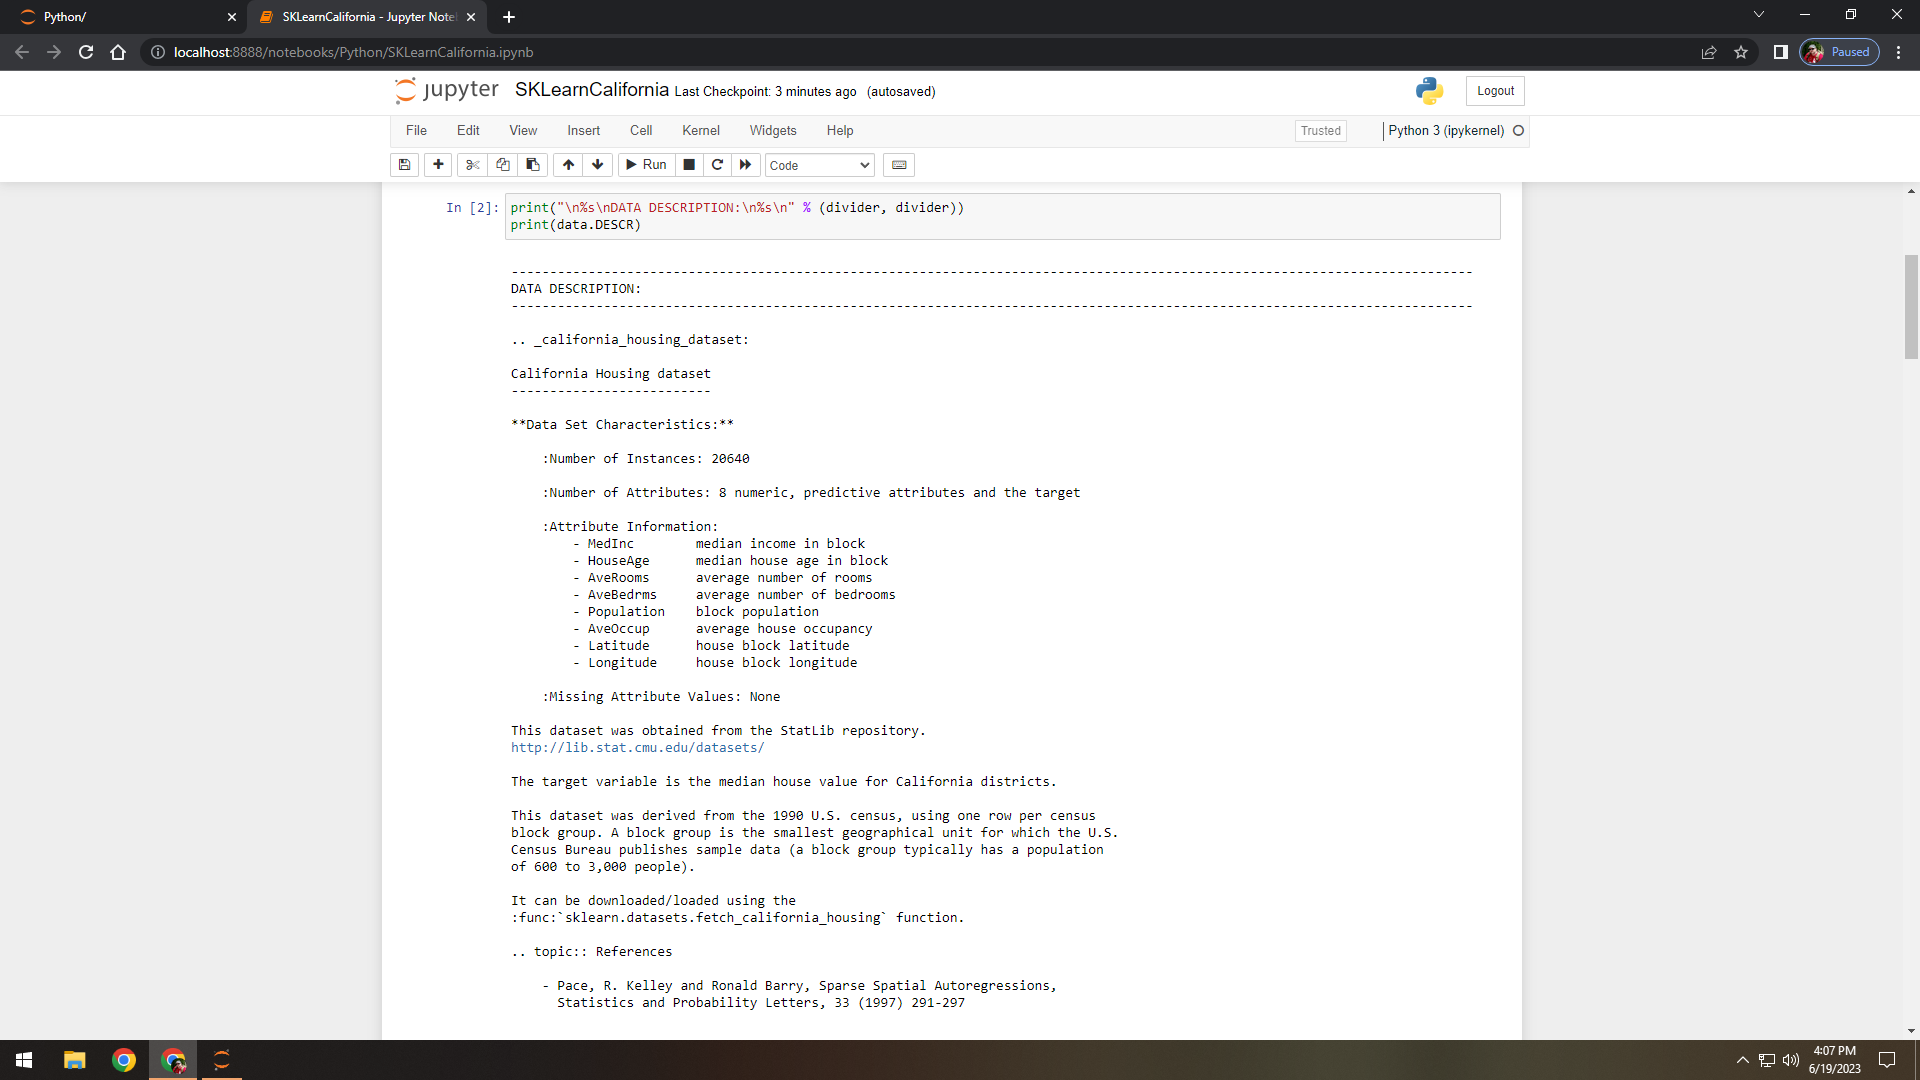
Figure 2. Displayed the included dataset description.
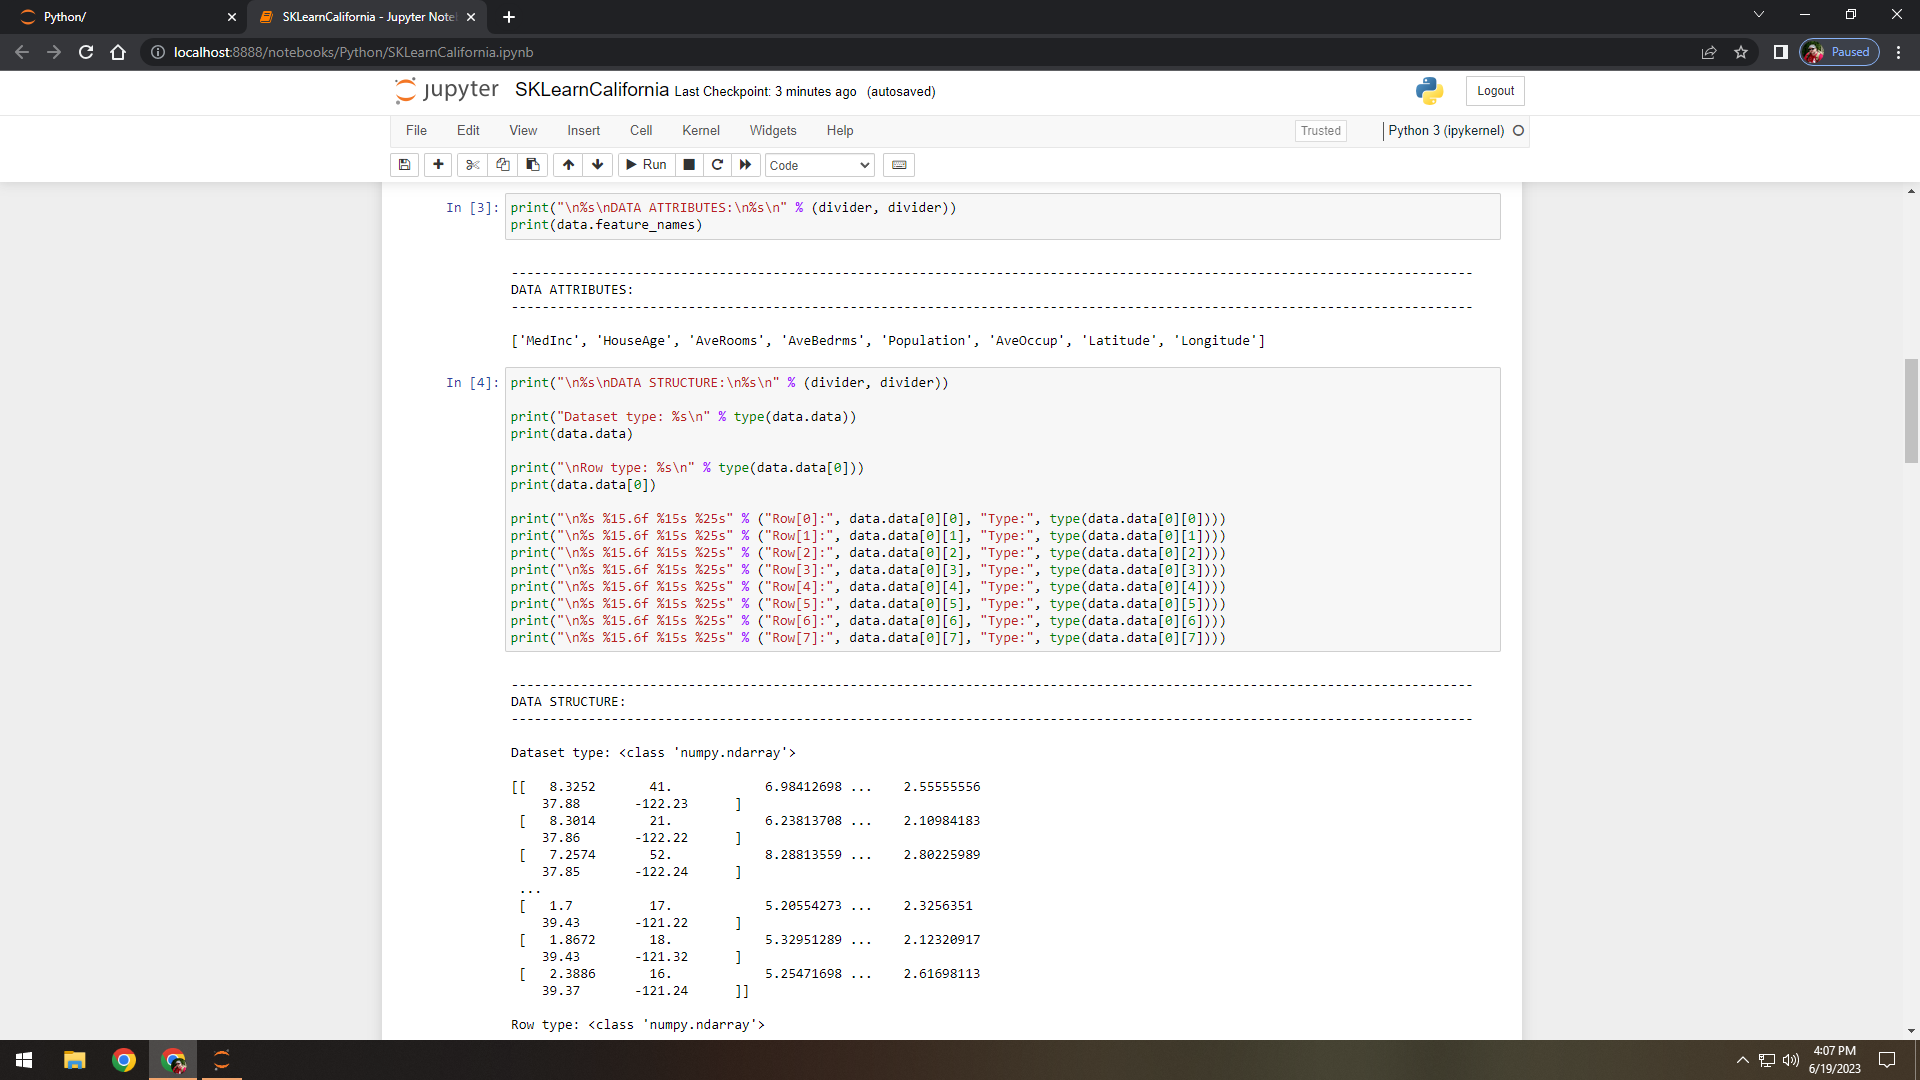
Figure 3. Displayed available data features (attributes).
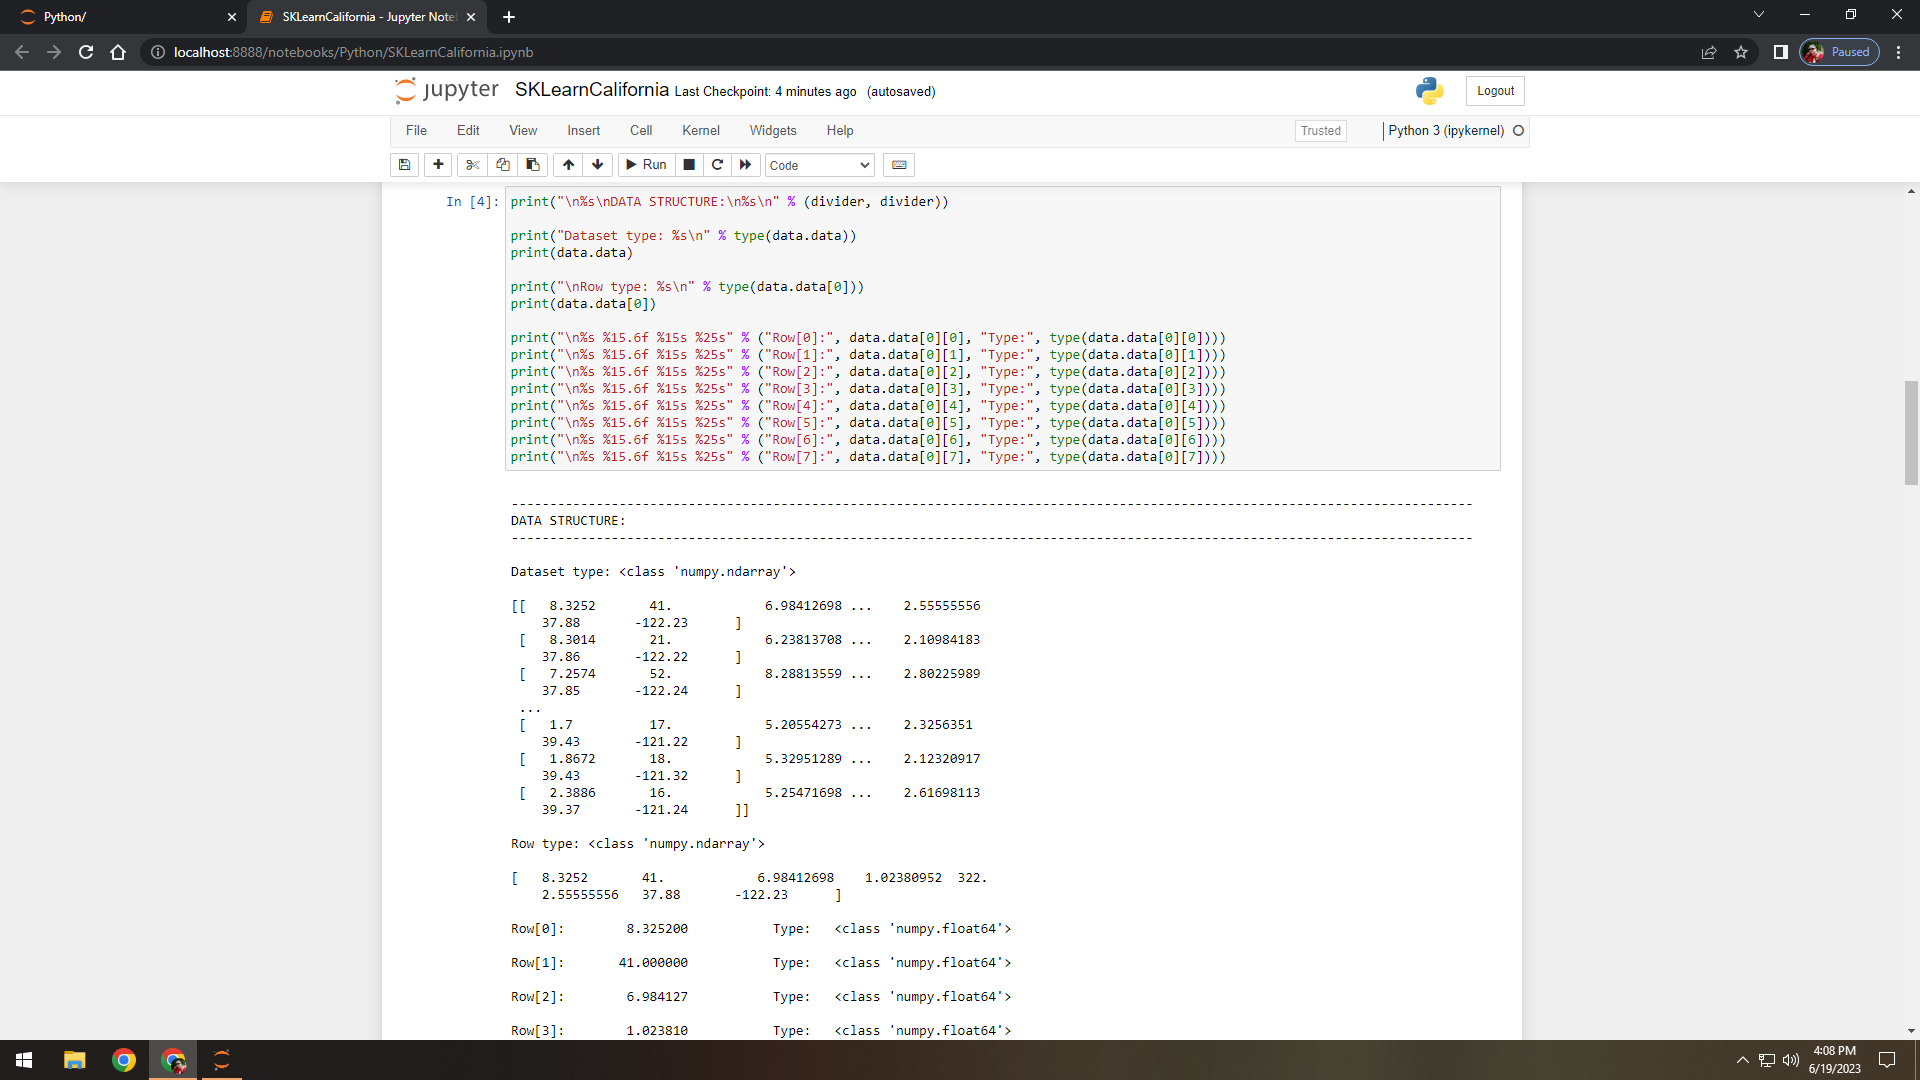
Figure 4. Displayed the data structures of set, rows, and elements.
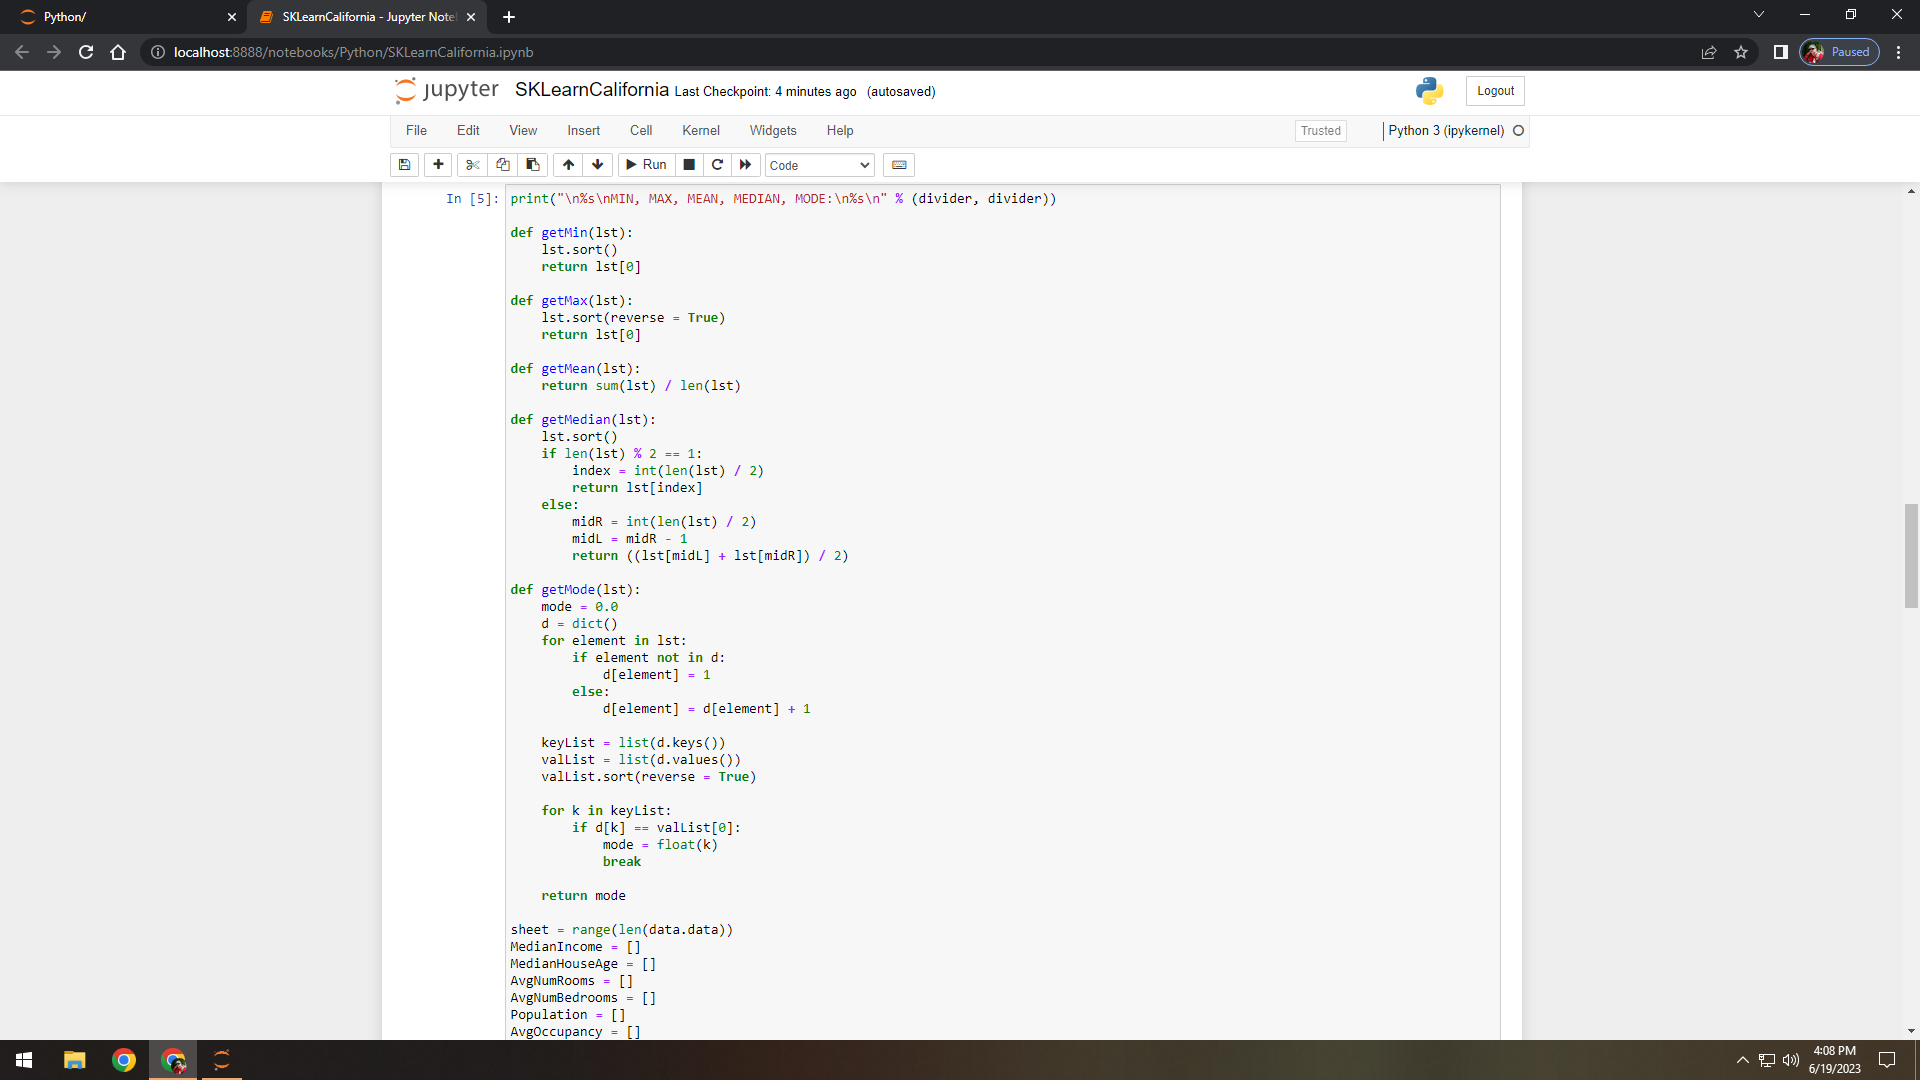
Figure 5. Created custom functions for min, max, mean, median, and mode.
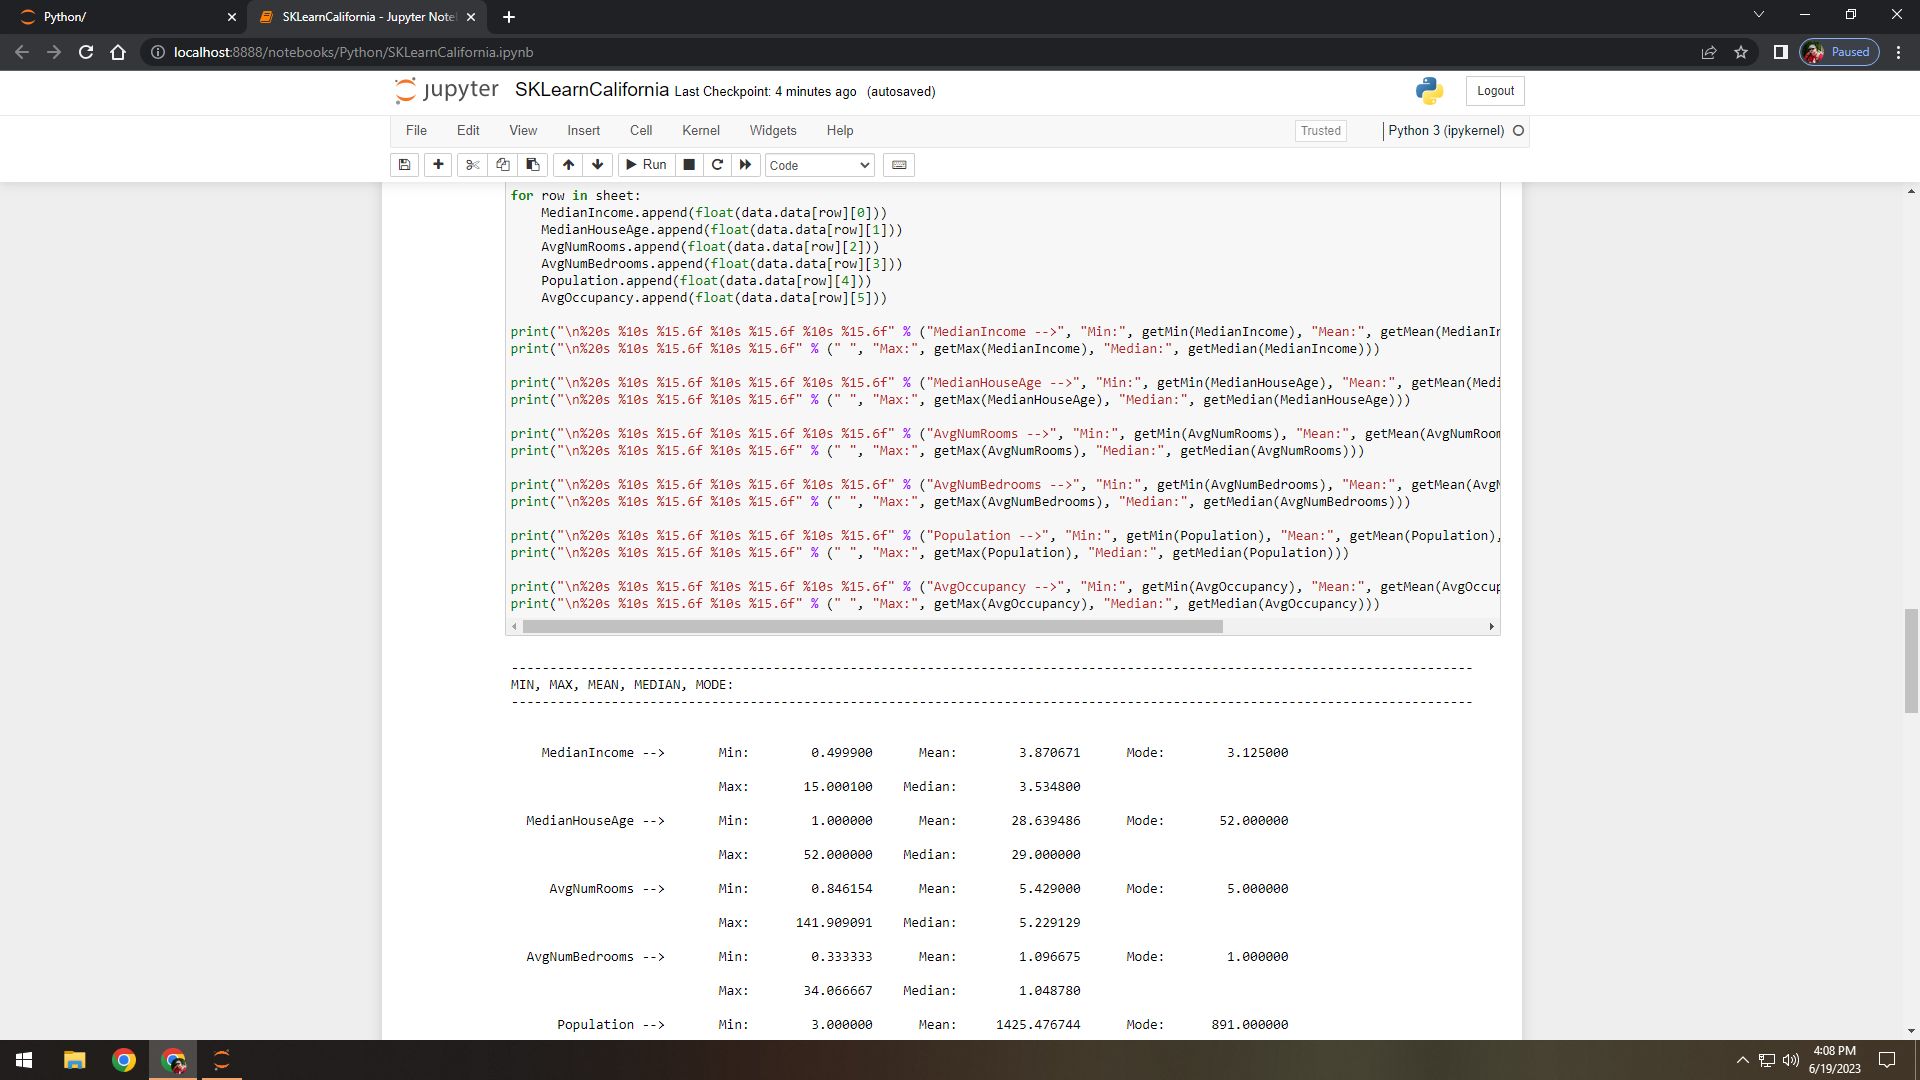
Figure 6. Split data rows into columns of data features and displayed statistics.
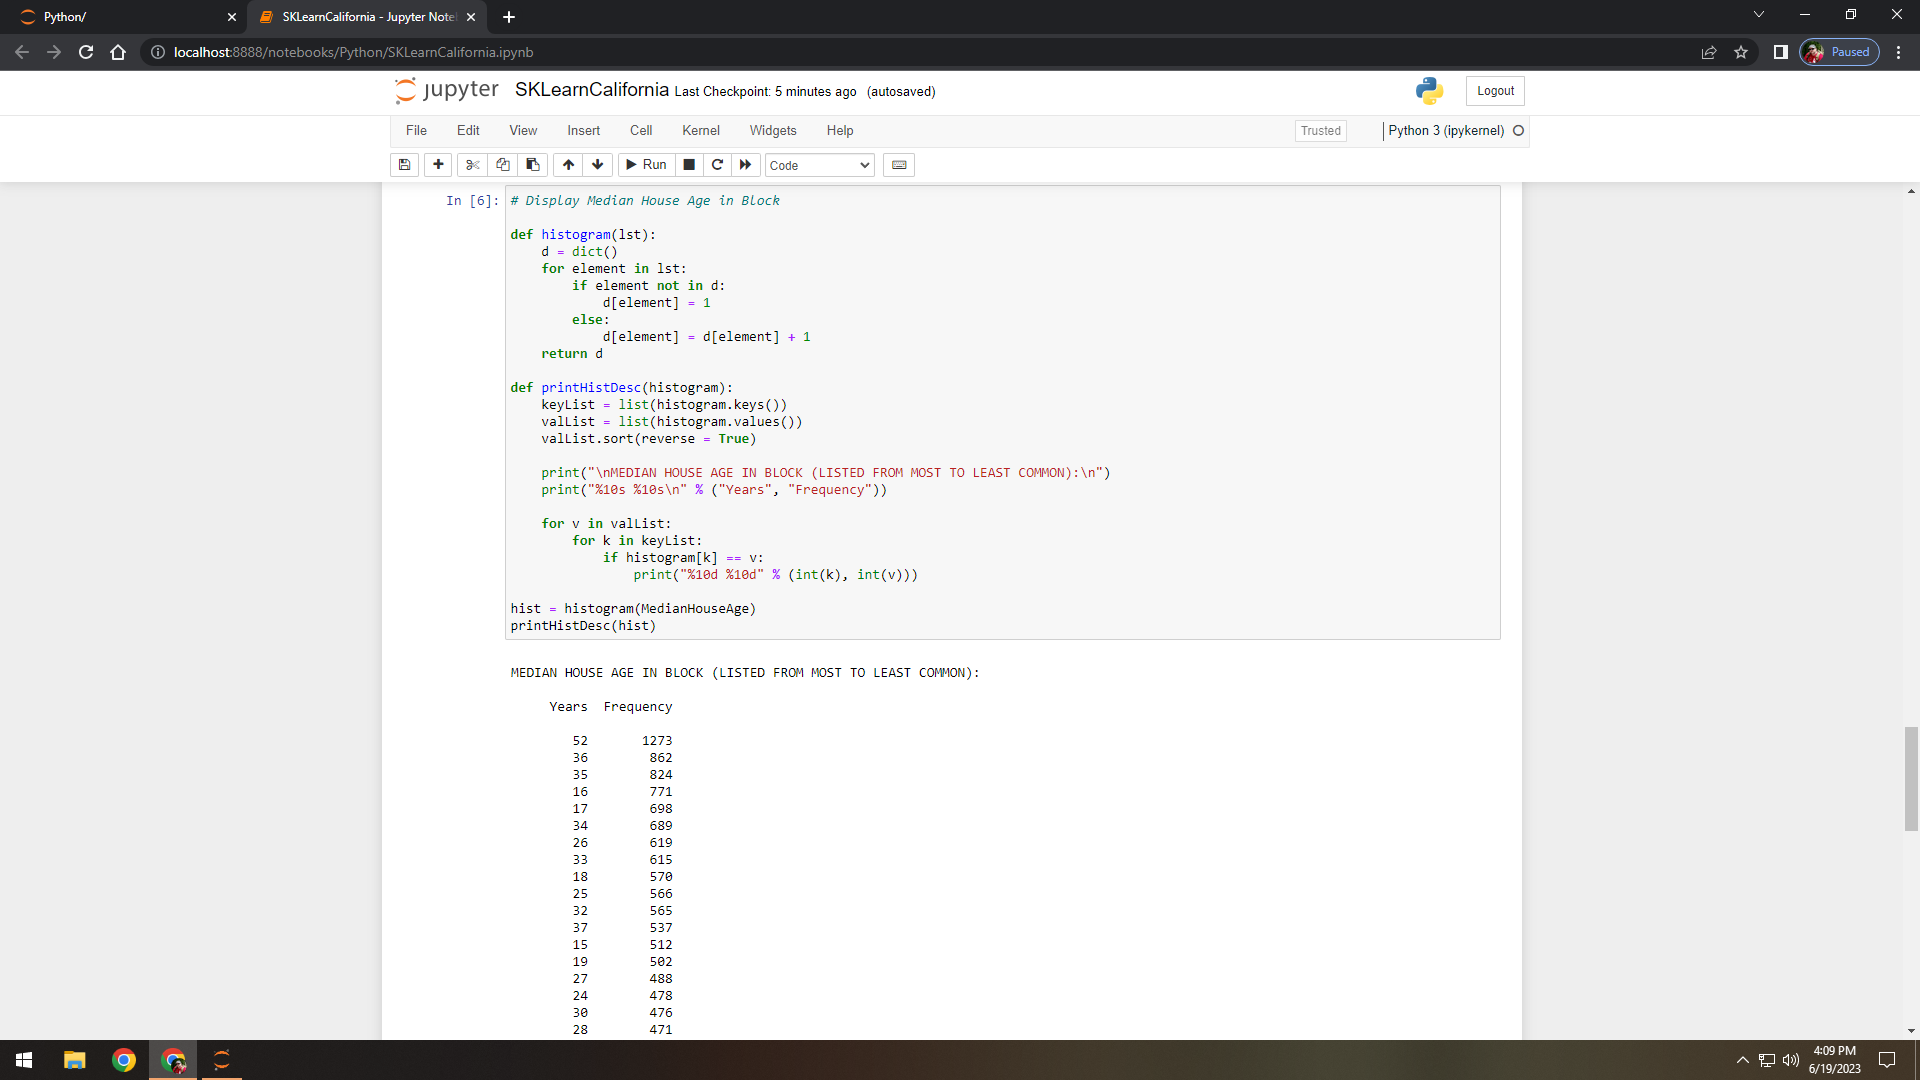
Figure 7. Calculated and displayed median house age from most to least common (frequency descending sort).
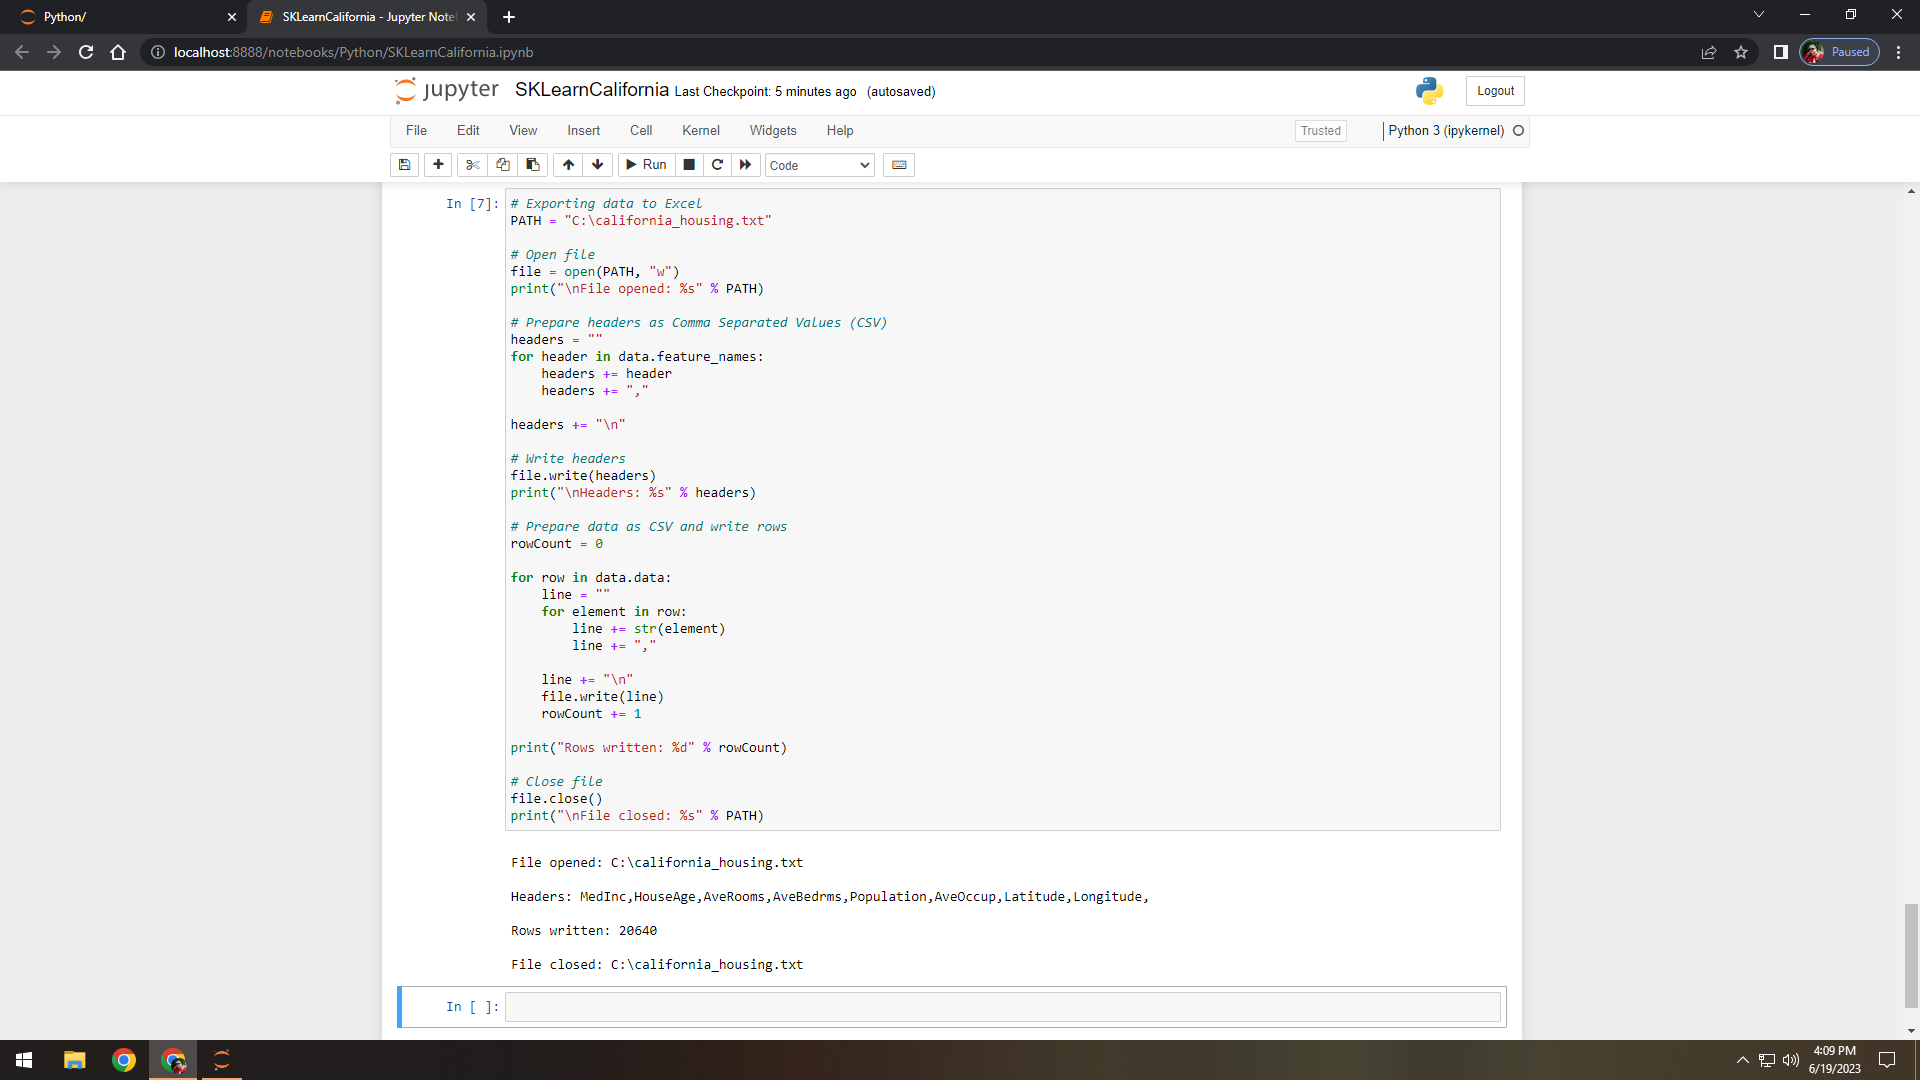
Figure 8. Used Python code to export data from Jupyter Notebook to a text file (comma separated values).
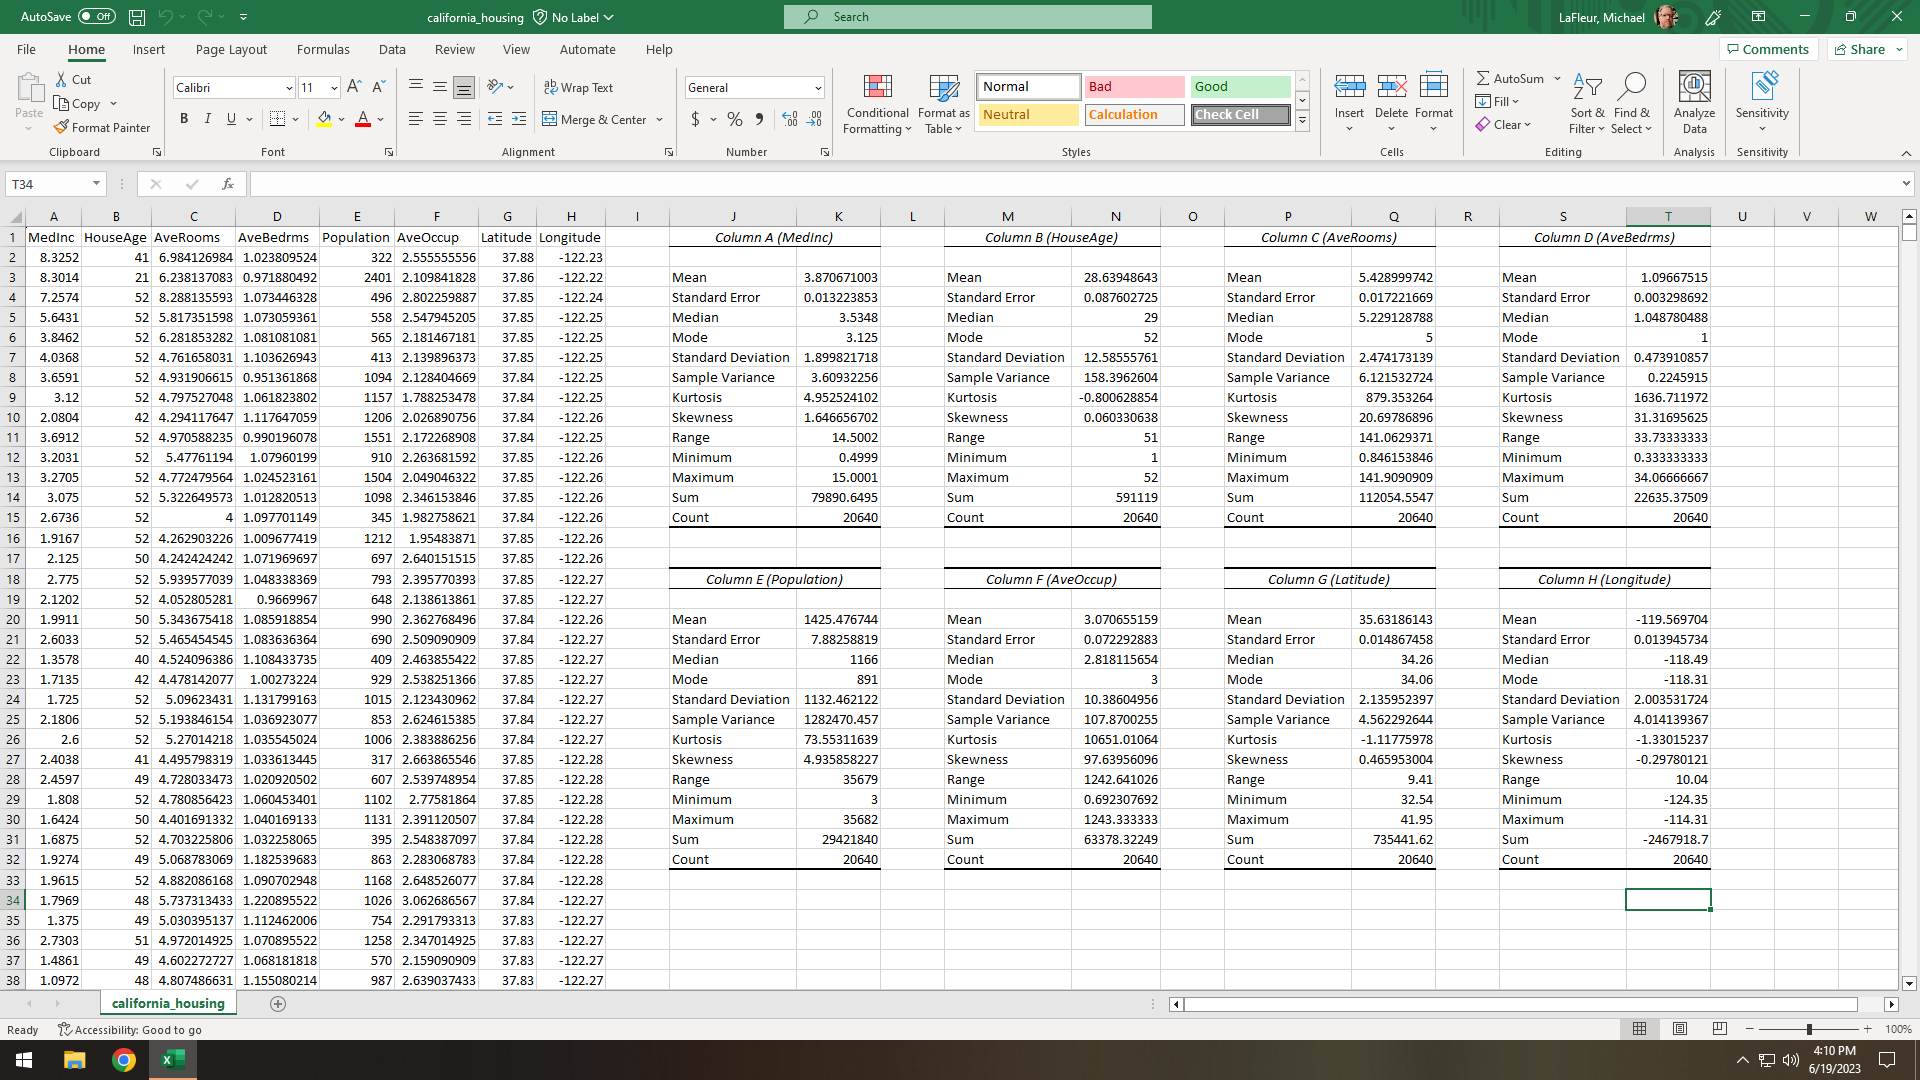
Figure 9. Opened CSV text file in Excel and analyzed descriptive statistics for each column.
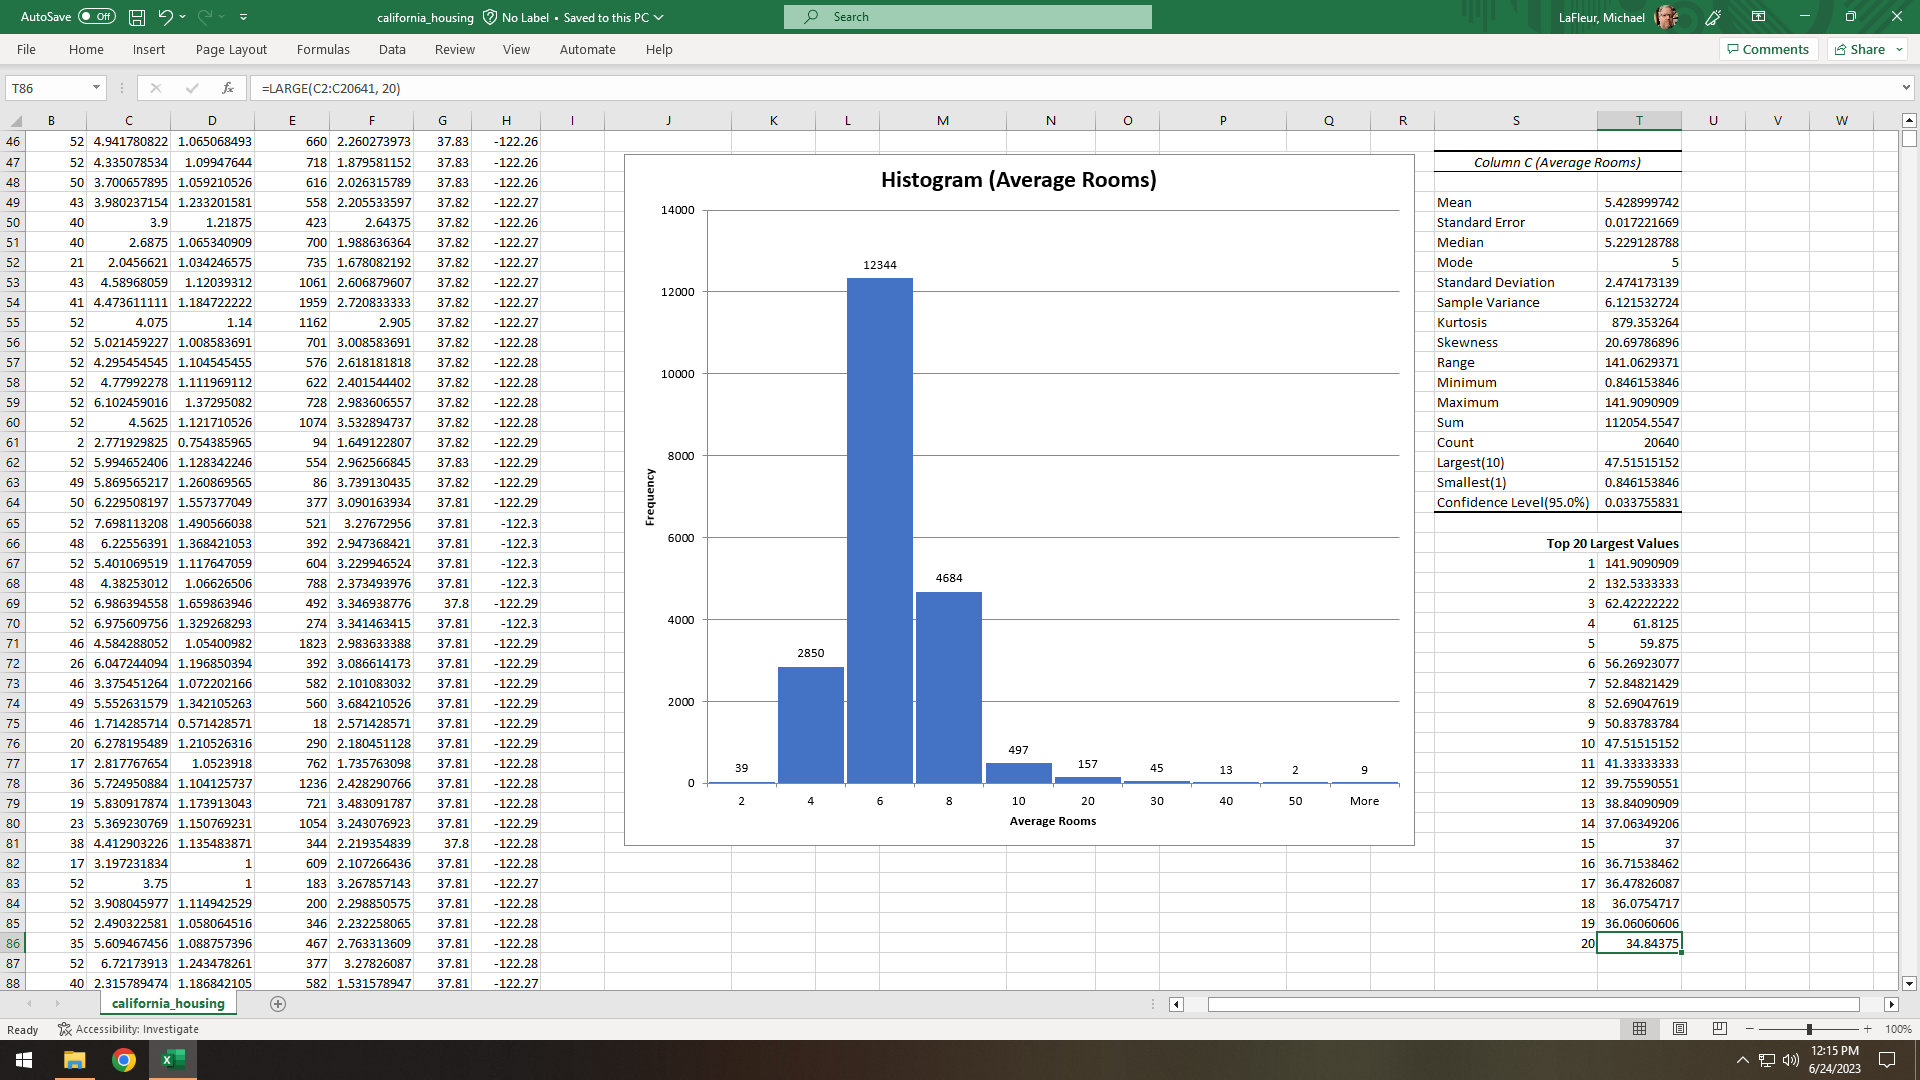
Figure 10. Created a histogram in Excel to explore unusually high values for average number of rooms. The histogram is skewed to the right (median < mean) by mansions like the 160-room Winchester Mystery House.