Social Trail Formation at Indiana Dunes:
Desire Path Prediction and Generation Modeled in JavaFX
Michael LaFleur
Informatics, Indiana University Kokomo
INFO-I 211: Information Infrastructure II (Java 2)
Spring 2023
Abstract
Social trails (desire paths) are formed when pedestrians create and use shortcuts. They are most often noticed as dirt paths cutting corners across lawns near sidewalk intersections. In a research review, this author learned that a social trail becomes visible between six and fifteen uses. At that point, more pedestrians are likely to view the trail as a non-trespassing path and continue its use. This end-of-semester JavaFX project draws an alphanumeric grid over a satellite photo of the West Beach Bath House at Indiana Dunes National Park. Simulated pedestrians are then created to travel from the beach to the building. Pedestrians choose to navigate (forward, backward, left, right) physical obstacles (elevation, terrain ruggedness) based on assigned personality traits (adventurer, trespasser) and proximity to official paths. Overland pathing is displayed via color and opacity changes to grid squares, which can then be compared to the social trails visible on the underlying map to determine algorithm accuracy.
Video (7 minutes 3 seconds): Narrated project demonstration
West Beach Bath House Map
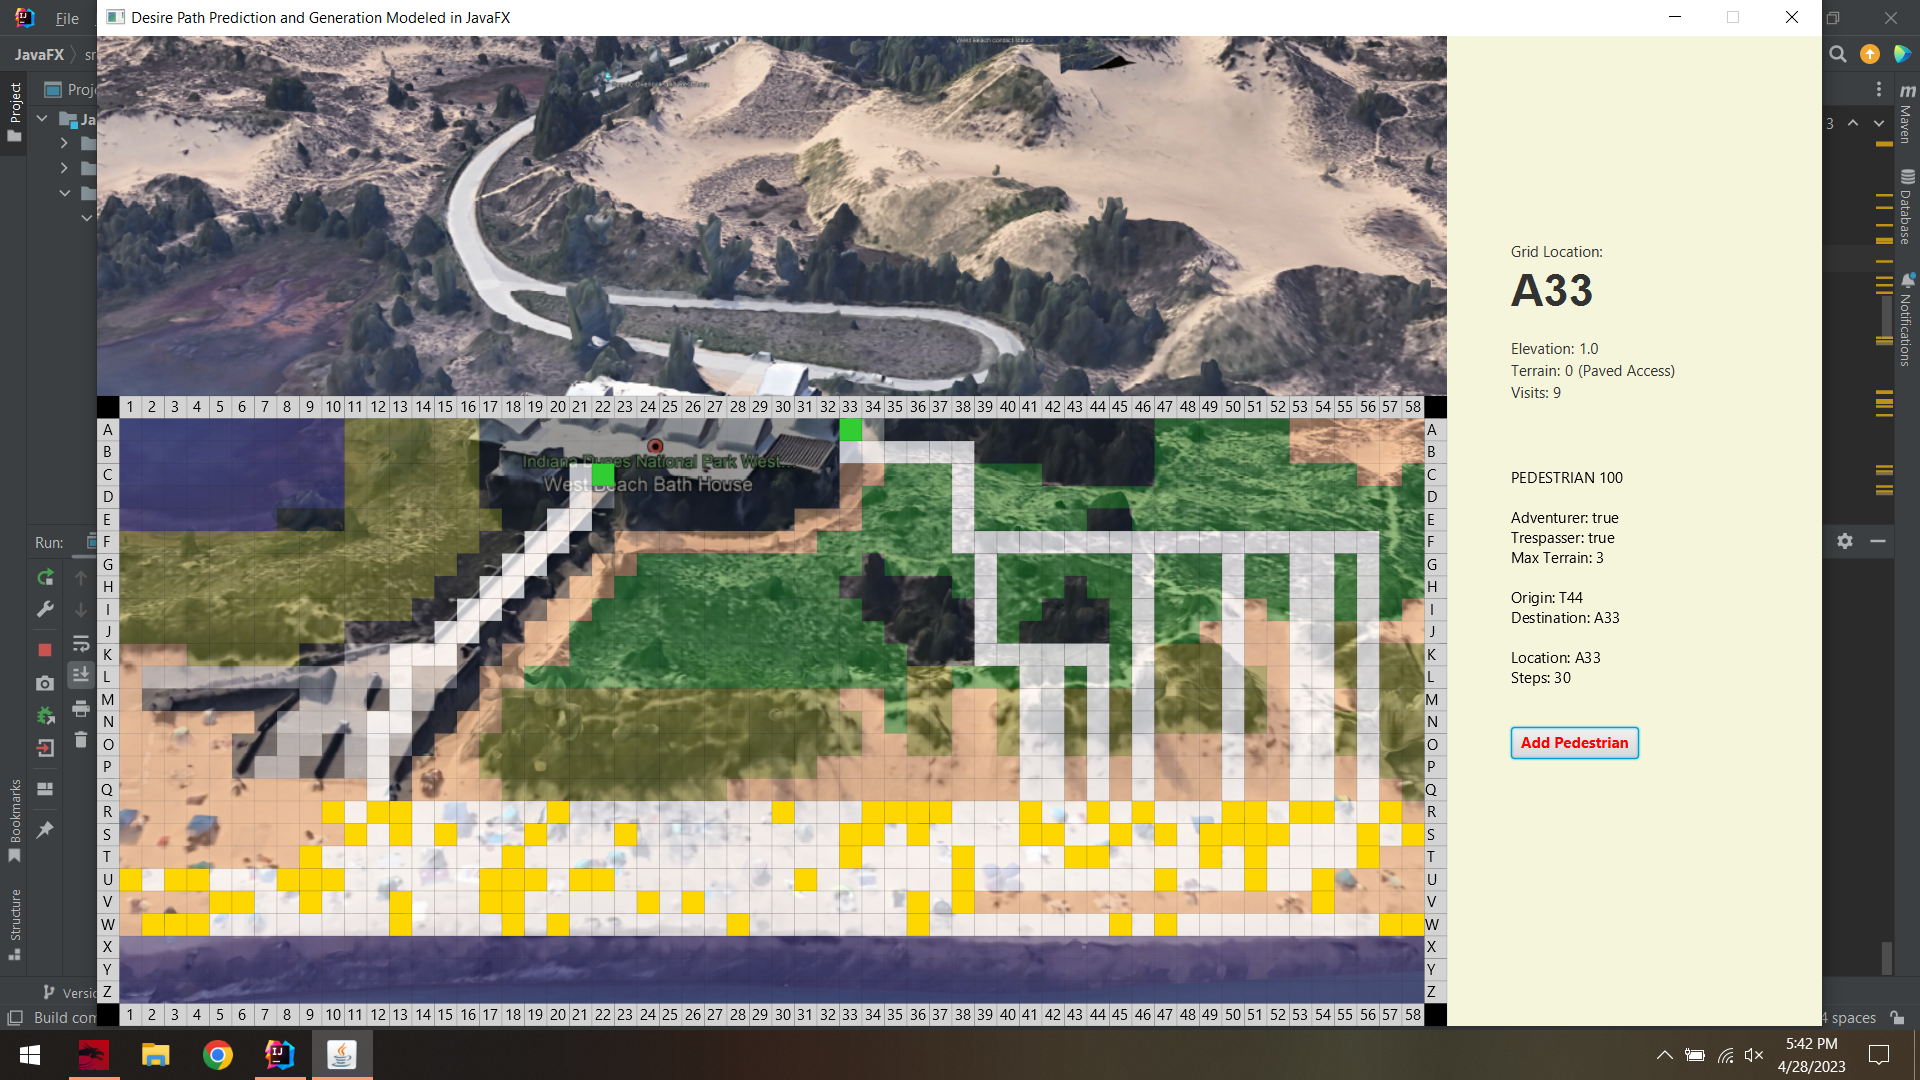
Figure 1. Nine simulated pedestrians (out of 100) took shortcuts from the beach to the building.
Introduction
The formation of social trails is inevitable. Pedestrians spent their childhoods at play without a second thought given to creating shortcuts through grass or weeds. In fact, discovering a dirt path and following it to unknown adventure was often the highlight of exploration. Children may have encountered an occasional “stay off the grass” or “restricted area” sign without asking why those deterrents (of varied ineffectiveness) were in place. As adults, pedestrians are perhaps more aware of the consequences of trespassing. Through education, pedestrians may learn to see their environment as an ecosystem that can be helped or harmed by various actions. This is evident in the U.S. National Park Service, who has devoted large amounts of resources to studying and mitigating the effects of erosion and habitat disturbance throughout all the National Parks.
Source Code
The files included in this project are GridSquare.java, Main.css, Main.java, and Pedestrian.java. Together, these files contain approximately 1,100 lines of Java and JavaFX programming.
Project Inspiration
In the summer of 2022, this author completed Indiana University Kokomo course GEOL-G 421 (United States Geology Field Experience: Indiana Dunes National Park). This course explored the historical and current geopolitical climate of Indiana Dunes, culminating in a week-long tour guided by park staff and managers of various stakeholder organizations. Social trails were one of the numerous concerns discussed.
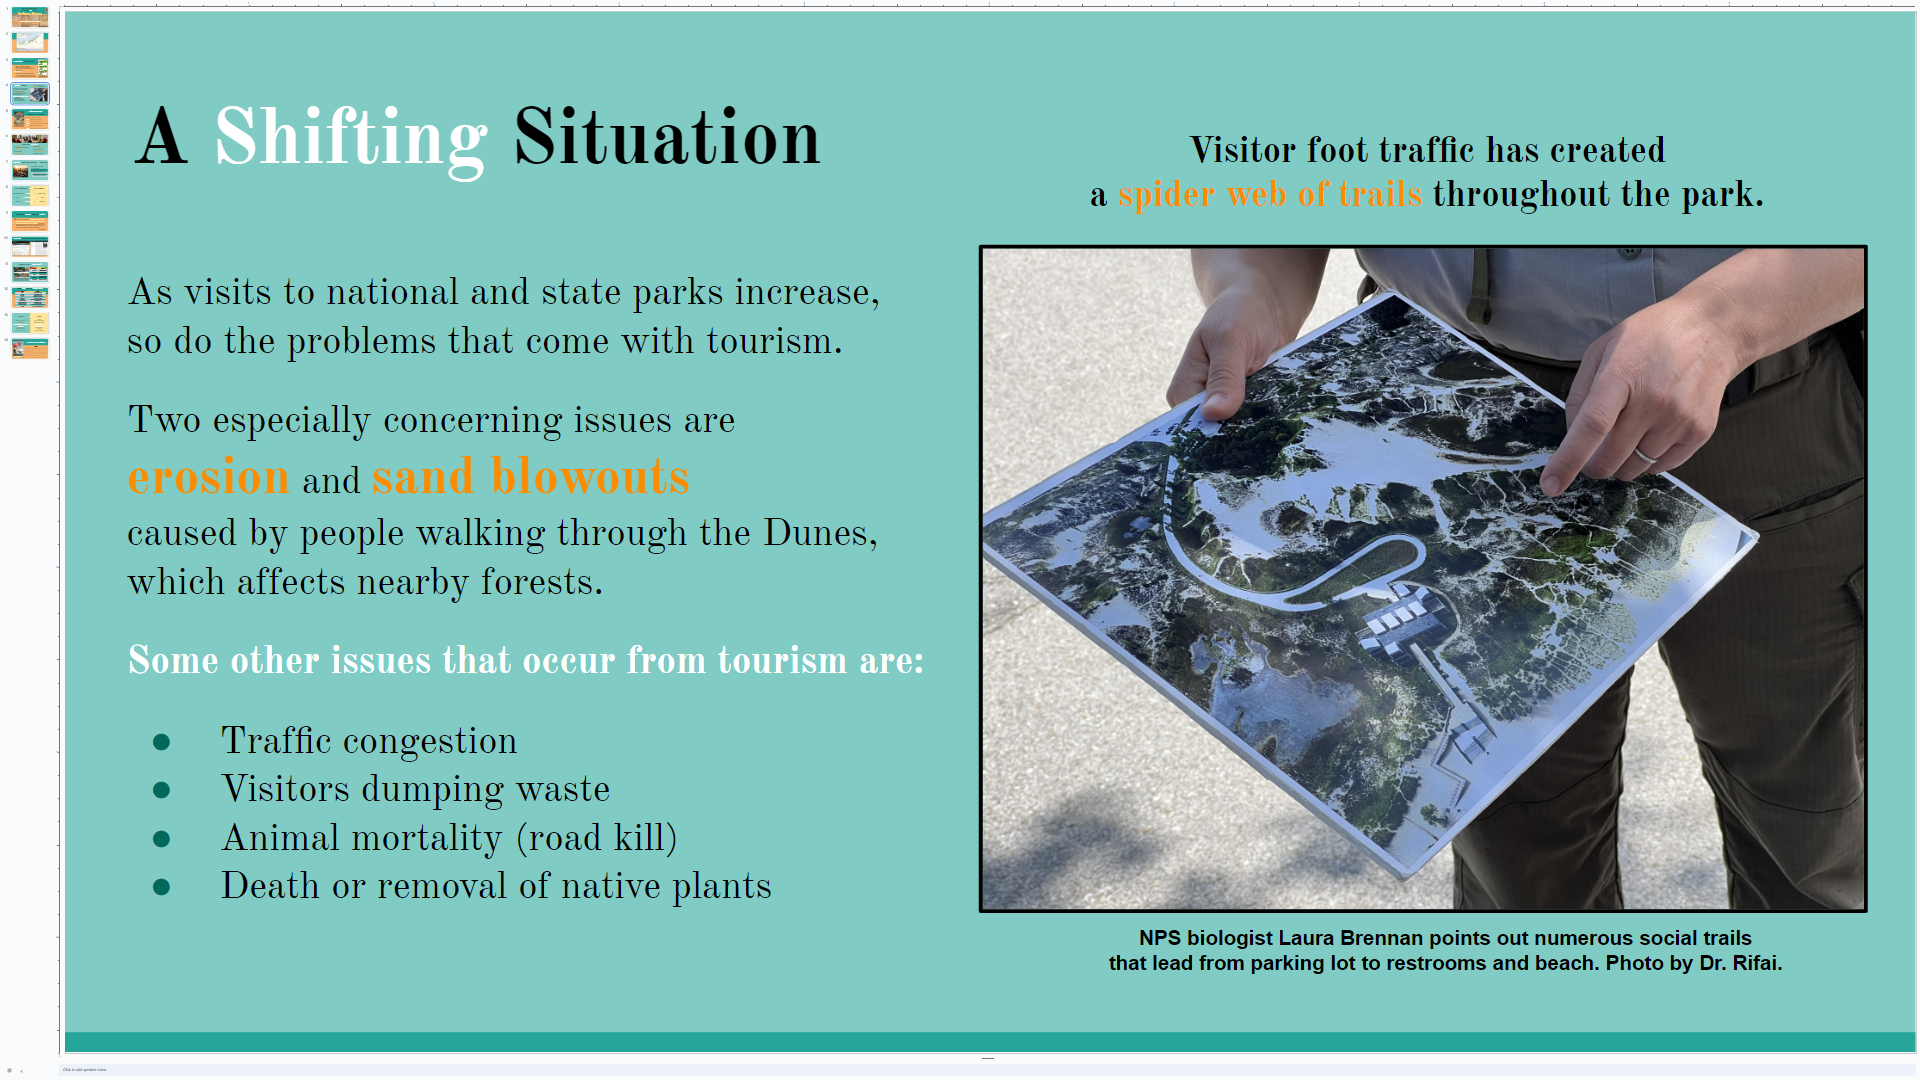
Figure 2. On a printed aerial map, NPS biologist Laura Brennan shows social trail erosion of the Lake Michigan beachfront. (Photo by Dr. Lina Rifai. PowerPoint slide by this author.)
Project Basemap
A satellite view of Indiana Dunes’ West Beach region was located by searching Google Earth online, which was then visually compared to the aerial map in Figure 2. Then the same region was found in Google Earth Pro desktop, rotated, zoomed in, and saved as a screenshot.
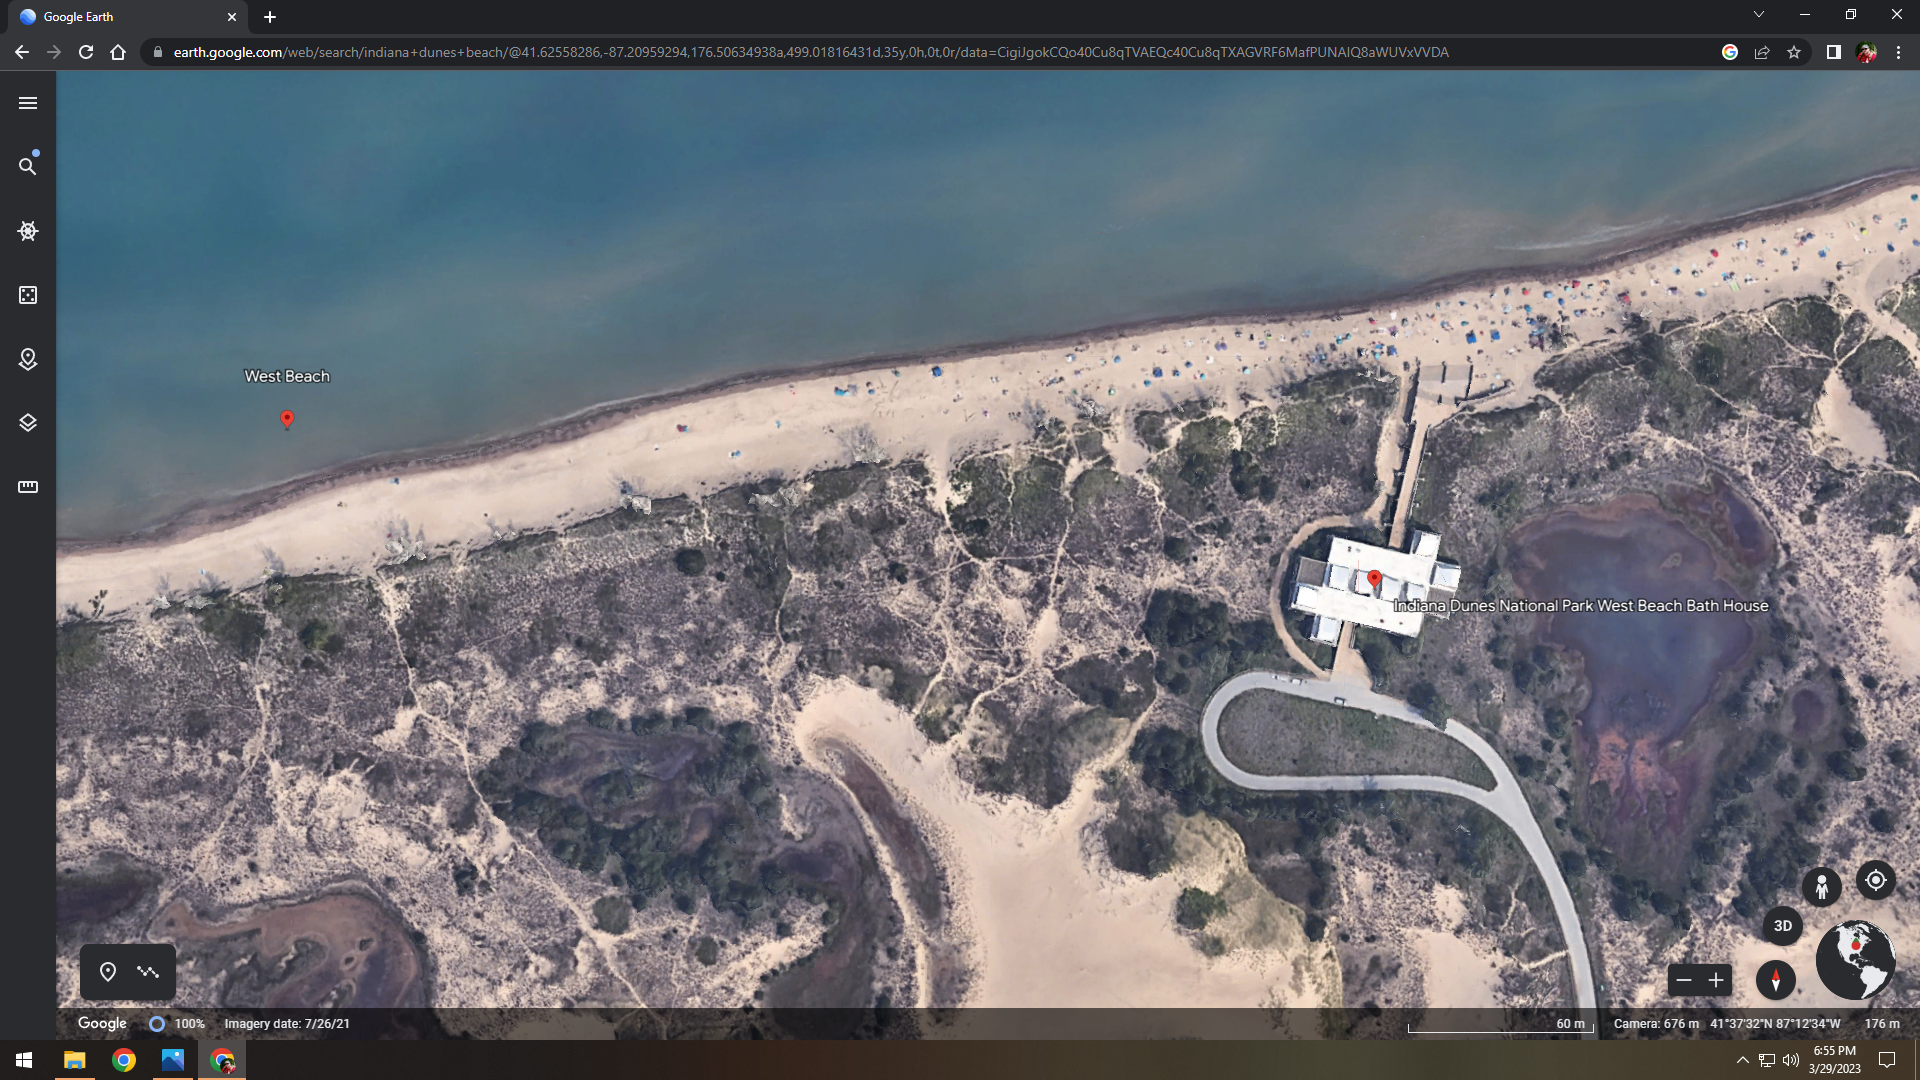
Figure 3. The Lake Michigan shoreline and Indiana Dunes’ West Beach region are visible in this north-oriented Google Earth online map.

Figure 4. The same view was found in Google Earth Pro desktop version and rotated to be south-oriented, matching the aerial map printed by the NPS in Figure 2.

Figure 5. The basemap was opened in Adobe Photoshop, grid lines were turned on, then another screenshot was obtained by this author. By cropping the screenshot to grid and counting the number of squares, each grid square was calculated to be 18 pixels by 18 pixels.
Grid Squares
The unmarked screenshot (Figure 4) was combined with grid square measurements (Figure 5) to create an alphanumeric grid overlay in JavaFX aligned with the shoreline. A custom GridSquare object was created as a subclass extending JavaFX’s default Rectangle object. By placing code inside of a nested for loop (one loop for X axis, one loop for Y axis), a single GridSquare template generated 1,680 (60 x 28) GridSquares. After reserving all 172 GridSquares around the perimeter to be alphanumeric text labels, the inner grid is composed of 1,508 GridSquares.
Grid Orientation
In traditional GPS, latitude and longitude are measured from the point (0, 0) where the Equator and the Prime Meridian meet. In JavaFX, point (0, 0) is located at the top left corner of the window. X values increase by moving toward the right edge. Y values increase by moving toward the bottom edge. Due to the sheer number of GridSquares, the grid (and project) scope was limited to the space between the beach and the building. By a stroke of luck, this space aligned neatly with the 26 alphabetical rows set to GridSquare measurements.
GridSquare Reference
As the nested loop generated the inner 1,508 GridSquares, each GridSquare’s String coordinate (i.e., “C22”) and memory address (object reference) were paired together in a global HashMap so individual GridSquares could be referenced at any time by their alphanumeric coordinate key.
GridSquare Attributes
After the grid was created, a custom method (initializeGridAttributes) iterated through every inner GridSquare and assigned values for terrain ruggedness (Figure 6) and elevation. Initially the bulk of the GridSquares were layered in loops to ease the workload, but several String coordinate arrays had to be typed (Figure 7) to match a terrain map that this author colored in Adobe Photoshop (Figure 8). This is the point where automation was no longer helpful. The amount of manual labor involved led to using these same arrays to assign simple elevation values. These integers (0-4) were originally going to be used in slope equations, but those calculations were cut from the project due to time and scope constraints. As a result, 0 is baseline and 4 is impassable. Closer to arbitrary assignment than actual elevation assessments, these integers remain in the project as placeholders to be improved upon (and to keep pedestrians from leaping over tall obstacles).
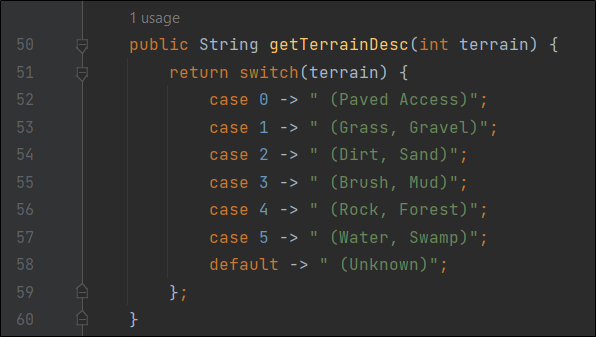
Figure 6. A switch statement translates terrain integers into descriptions.
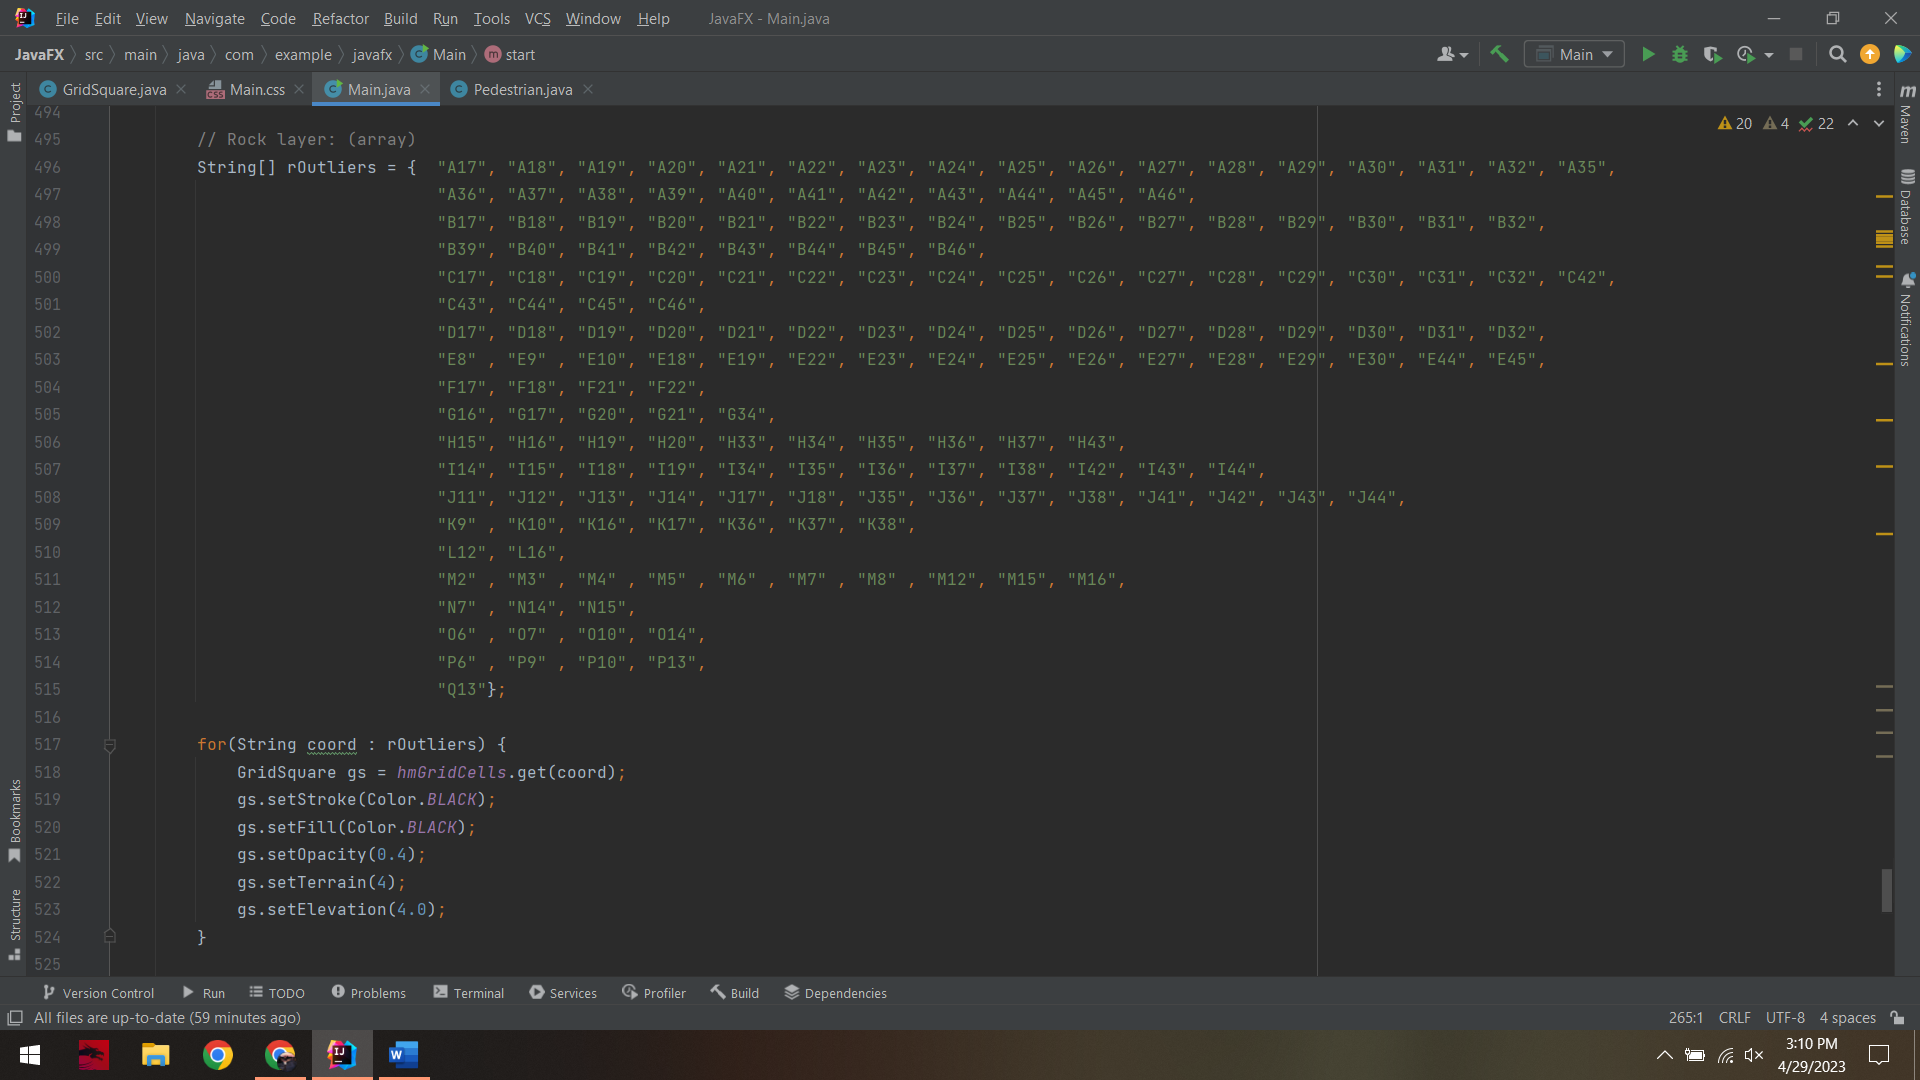
Figure 7. One of five String arrays guides the assignment of terrain and elevation values.
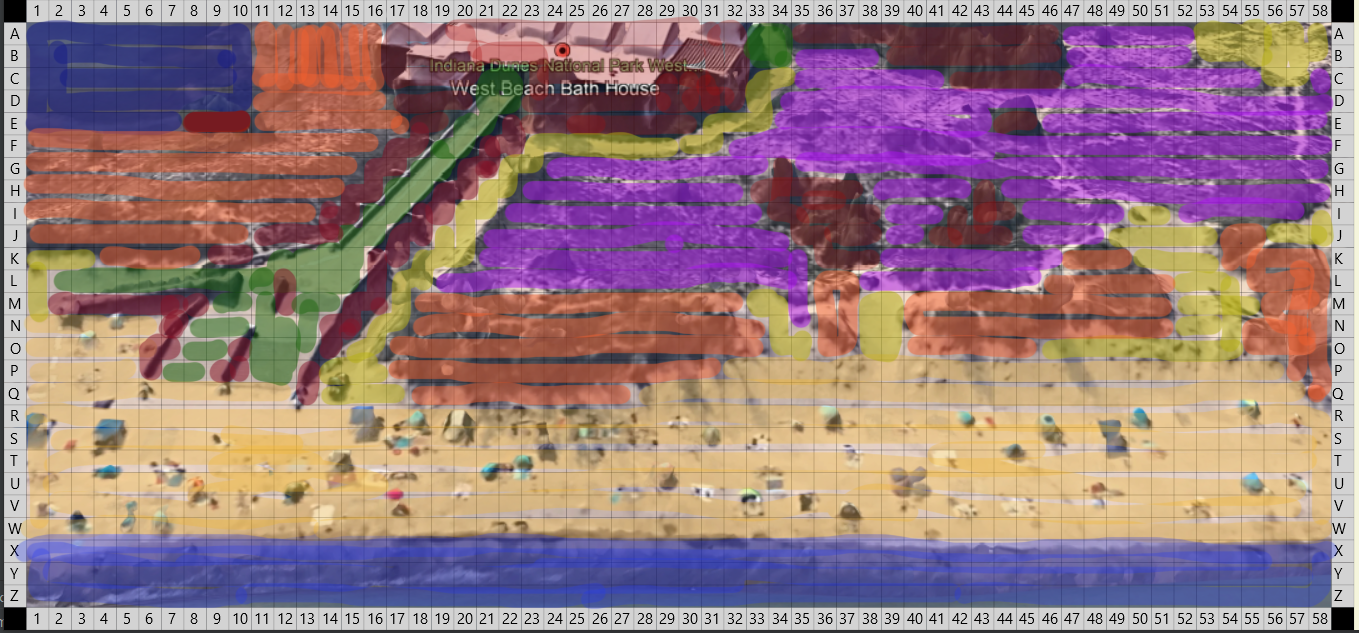
Figure 8. Terrain differences were manually highlighted in Adobe Photoshop as preparation for creating String arrays. Colors were reproduced in code, then changed to be more realistic.
Pedestrian Attributes
Simulated pedestrians are assigned two personality attributes: adventurer and trespasser. One study ( https://www.cam.ac.uk/research/news/pedestrians-choose-healthy-obstacles-over-boring-pavements-study-finds ) determined that 14% to 78% of pedestrians are adventurous walkers. This project splits the difference of that range and assigns a 46% chance of being an adventurer. Another study that was read a month ago (but the source currently eludes this author) stated that pedestrians were observed choosing a shortcut over a path 40% of the time.
Predicting Behavior
Compared to pedestrian pathing research that analyzes video footage with machine learning science, this project’s algorithm is crude and simplistic. Adventurers will consider GridSquares with terrain 3 (brush, mud), while default pedestrians are limited to terrain 2 (dirt, sand). Trespassers were going to encounter various obstacles like traffic cones and staffed gates (NPS studies have proven that staffing reduces trespassing), but that idea was scrapped to limit project scope. Instead, there are three requirements that must be met for a simulated pedestrian to create and use a shortcut: be an adventurer (46% chance), be a trespasser (40% chance), and be further away from the official path (to the right of grid column 37).
Pedestrian Pathing
Simulated pedestrians move in four directions: forward, backward, left, and right. These directions are determined before each step by comparing the X and Y coordinates of the current location versus the destination. Starting points are randomly assigned as beach origins ranging from GridSquares R1 to W58. Pedestrians will move along one axis toward the destination, then switch to the other axis when that row or column is reached (or when encountering an obstacle in elevation or terrain values). In lieu of calculating whether pedestrians have line of sight to the building, paths angle by sending pedestrians to a milestone point before continuing to a destination. Pedestrians following an official path will aim for GridSquare R12, followed by GridSquare C22 (the front door of the building). Pedestrians trespassing over a shortcut will aim for GridSquare F38, then continue to GridSquare A33 (the back door of the building). All pedestrians track their total number of steps taken, plus the String coordinates of GridSquares traveled are stored in an ArrayList.
Quantifying Erosion
Hikers have claimed that social trails become visible after as few as six uses, while others note the trample value is 15 uses ( https://en.wikipedia.org/wiki/Desire_path ). In this project, each GridSquare tracks its number of visitors. A custom method (erodeTerrain) reduces the terrain ruggedness by one for every five visits. The initial plan was to demonstrate that erosion increases foot traffic over time as pedestrians view paths becoming more acceptable to use. To control this project’s scope, this idea was folded into adventurers’ maxTerrain attribute. Human impacts were visualized through manual clicking of an “Add Pedestrian” button. This author captured screenshots of various simulated pedestrians: 1, 25, 50, 100, 250, 500, 750, and 1,000. It was determined that 5-10% of simulated pedestrians took shortcuts using social trails. Plotted paths were visually compared to the underlying basemap to determine accuracy.
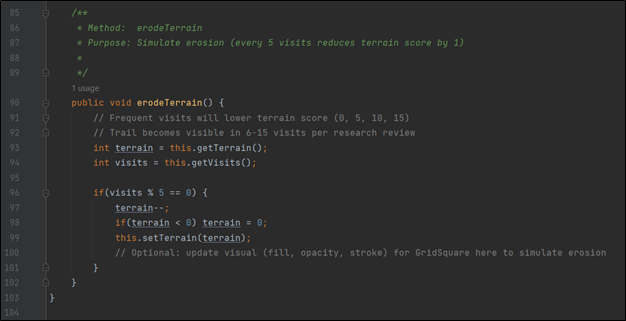
Figure 9. Each GridSquare simulates terrain erosion when visited by pedestrians.
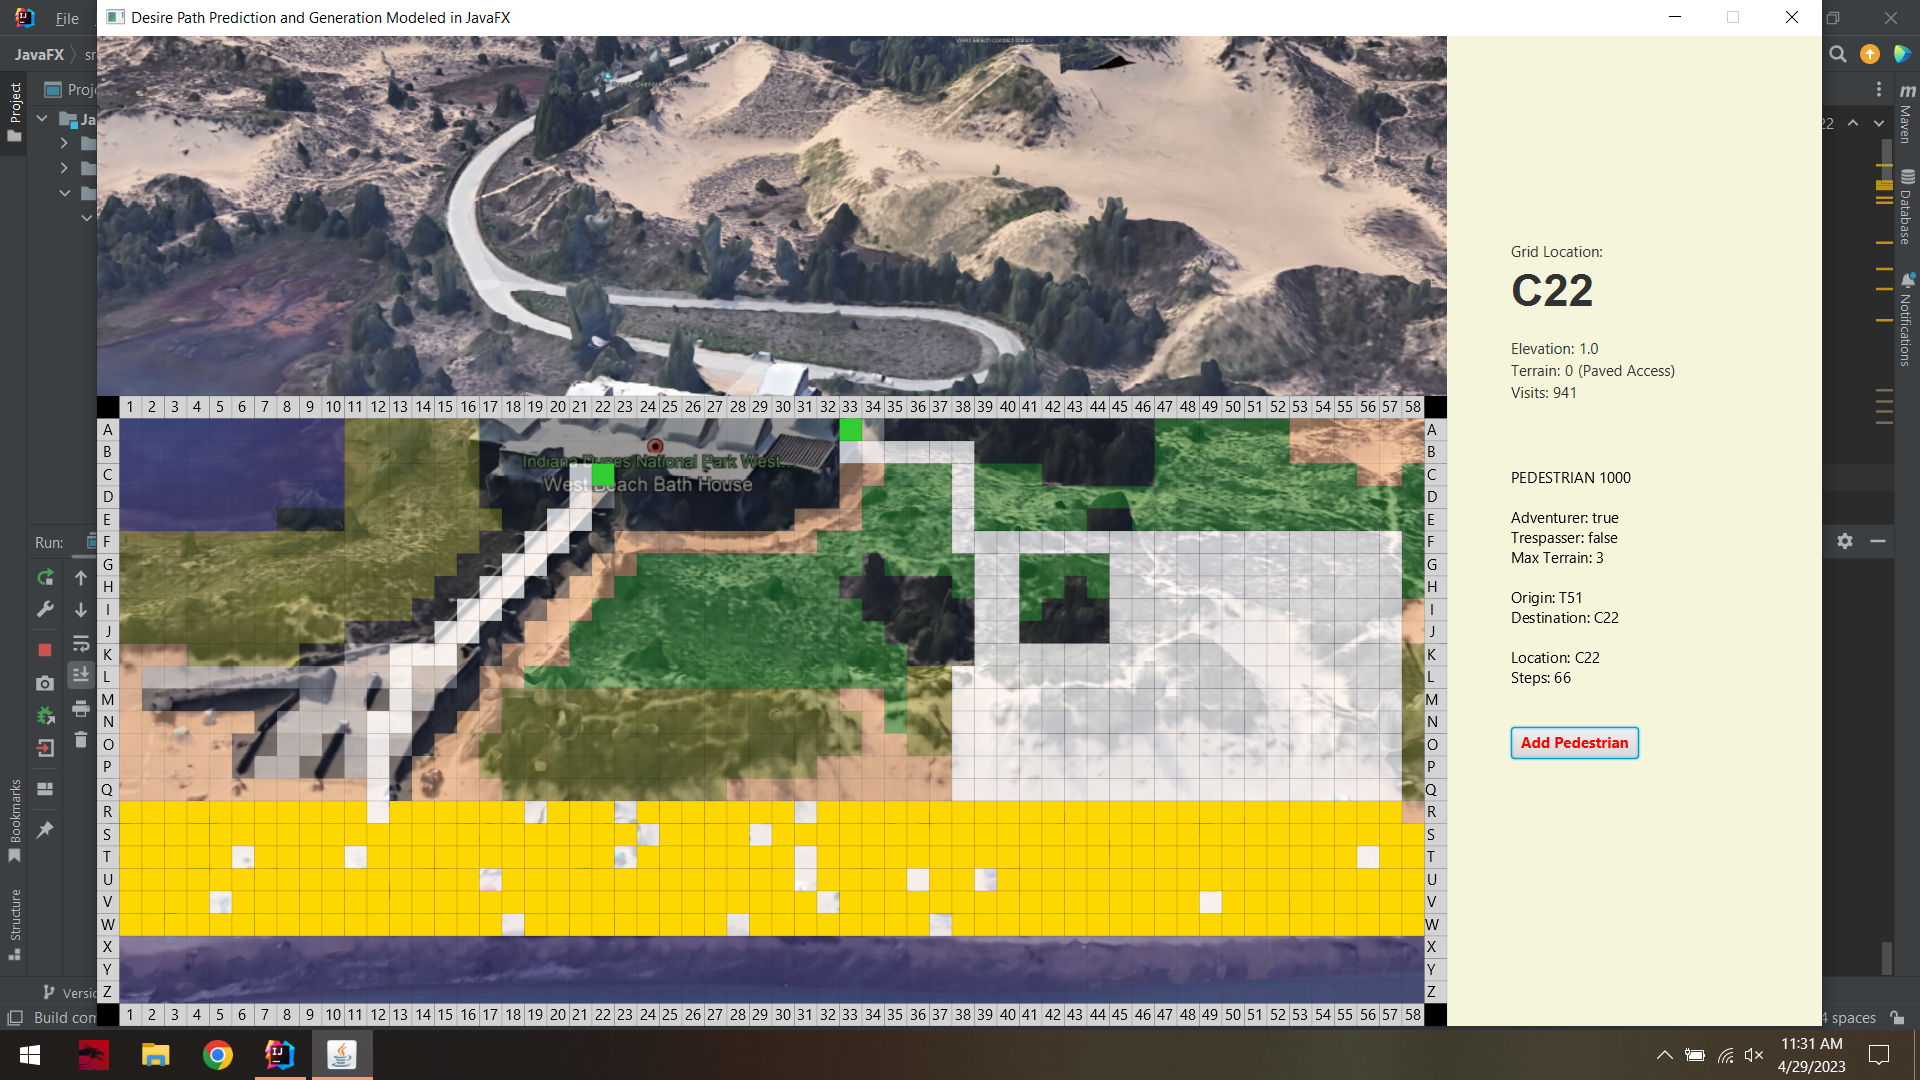
Figure 10. Out of 1,000 pedestrians, 941 reached the building via an official path. The massive right-side traffic aligns with the ridge blowouts visible in the underlying basemap.
Conclusion
Social trails may be enticing in childhood adventures, but can cause serious habitat disruption in protected ecosystems. Path prediction studies should consider both physical and psychological attributes when attempting to model pedestrian behavior.
Project Resources
Additional Reading
