Campus AED Map:
Constructing a Voronoi Diagram From Thiessen Polygons With ArcGIS Runtime Java API
Michael LaFleur
Informatics, Indiana University Kokomo
INFO-I 210: Information Infrastructure (Java 1)
Spring 2022
Abstract
After sudden cardiac arrest, an automated external defibrillator (AED) delivers an electrical shock that attempts to reset a fatal heart rhythm (ventricular fibrillation or pulseless ventricular tachycardia). Knowing where to quickly find an AED in a public space is essential to providing CPR and first aid. The map created in this project is a Voronoi (pronounced VORE-annoy) diagram of AEDs that are installed in public access stations on the Indiana University Kokomo (IUK) campus. Each Thiessen polygon contains one geotagged AED and illustrates an area where that AED is the closest defibrillator to retrieve during a medical emergency. In addition, this Voronoi diagram can predict where the university should place the next AED it acquires (by solving the "largest empty circle problem"). Thiessen spatial analysis tools are available in Esri's ArcGIS suite of products but seem to be absent from ArcGIS Runtime's Java API. This project documents how Thiessen functionality was replicated in Runtime through a series of manually intensive tasks, including Java methods the author programmed to extract coordinates from third-party code that has been iterating online for nearly forty years. Data collection, validation, and display concerns within the limitations of current mapping technology are discussed. Finally, recommendations for developing a public safety phone app are presented. The author is a retired paramedic and a full-time geoinformatics student.
Video (1 minute 40 seconds): What is an AED?
Campus AED Map
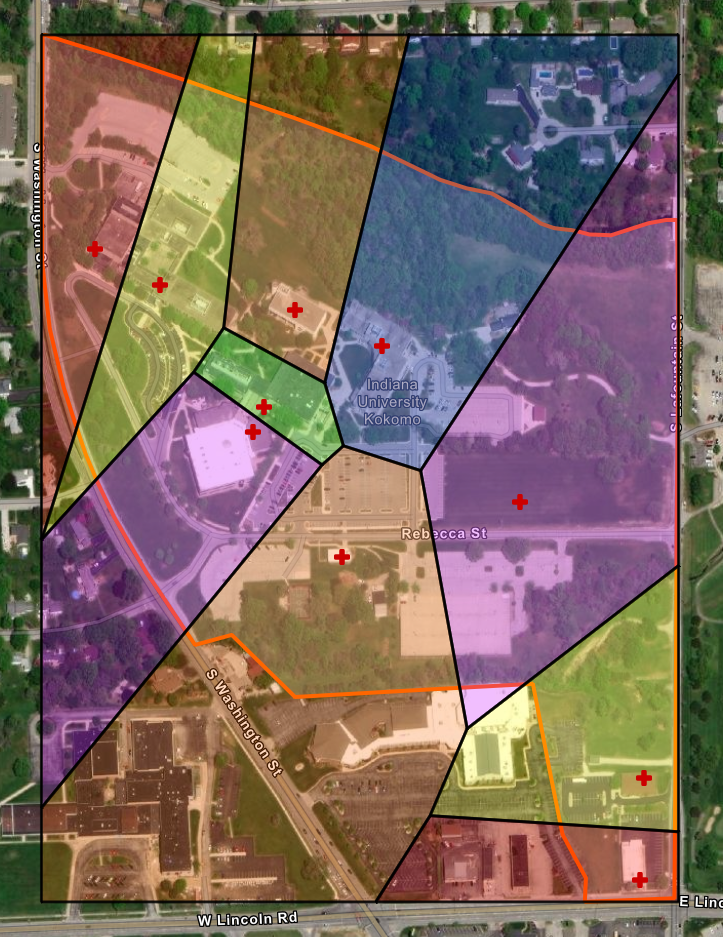
Figure 1. If a cardiac arrest occurs in the blue zone, CPR should include an AED from Hunt Hall (own photo).
Data Collection
As mentioned in the companion project Campus AED Map: Converting Coordinates, Calculating Haversine Distances, and Displaying a Grid With Java, ten automated external defibrillators (AEDs) on the Indiana University Kokomo campus were geotagged in person by the author using the SurveyCam Android app. At each AED, a photograph was obtained while placing a phone directly on top of the installation box. SurveyCam's default settings recorded the latitude and longitude of each phone location.
The campus boundary (orange line in Figure 1) was hand-plotted with the online Map Polygon Polyline Tool located at https://www.keene.edu/campus/maps/tool/ . The author zoomed out from the tool's default location, panned southwest to Indiana, zoomed in to the Kokomo campus, then began right-clicking points along the creek and roads that surround campus. The southern jogs in the campus boundary (around a landscaping business and a church building) were approximated.
The bounding box was created from known campus intersections (northwest and southeast corners). The southwest and northeast corners are simply the corners that complete the vertical rectangle.
| Early Outreach: | 40.45627, -86.12740 |
| East: | 40.46000, -86.13105 |
| Fine Arts: | 40.45546, -86.12744 |
| Hunt: | 40.45971, -86.13014 |
| Kelley: | 40.45923, -86.13137 |
| Library: | 40.45903, -86.13148 |
| Main (central): | 40.46020, -86.13246 |
| Main (Havens): | 40.46048, -86.13314 |
| Observatory: | 40.45803, -86.13055 |
| SAEC: | 40.45847, -86.12869 |
Table 1. AED locations, latitudes, and longitudes.
Data Validation
Because each AED was visited in person (and photographed for potential use in an app), the author became familiar with their locations and could easily spot discrepancies in data mapped over a building layout layer. First, the author learned that the AED list published by the university does not distinguish between ground floor units and units on multiple levels (basements, upper stories) that share the same geotag. Second, not only is the new Student Activities and Events Center (SAEC) missing from the AED list... the building itself is not visible yet on ArcGIS Runtime's satellite map! Third, phone GPS accuracy is limited to 16 feet and can be affected by walls, trees, and weather. Finally, the author did not want to alarm staff by lingering at AED boxes so a five-minute satellite data refresh was not confirmed.
When the author discovered that map pins were incorrect in three locations (Havens, SAEC, and Fine Arts), those AEDs were revisited. Geotags were repeated (directly on top of each AED box, as before) and were also obtained outdoors at the nearest building exits for comparison. While mapping those updated points, the author observed that a fourth location (Early Outreach) was in the wrong corner of the correct building. Photographs of that AED were reviewed and the point was adjusted by hand in Google Maps, which displayed the updated coordinate after pin placement.
Data Display
This project started as a drawing on a printed campus map. Midpoints were measured with a ruler, which was also used to draw straight lines. Bisectors are perpendicular on the drawn map (Figure 2) but appear skewed on the final map (Figure 1). This is due to distortion that occurs between geographic and projected coordinate systems.
AEDs are not labeled on the final map because the author's API key did not have access to online feature layers without registering a developed app, which was beyond the scope of this project.
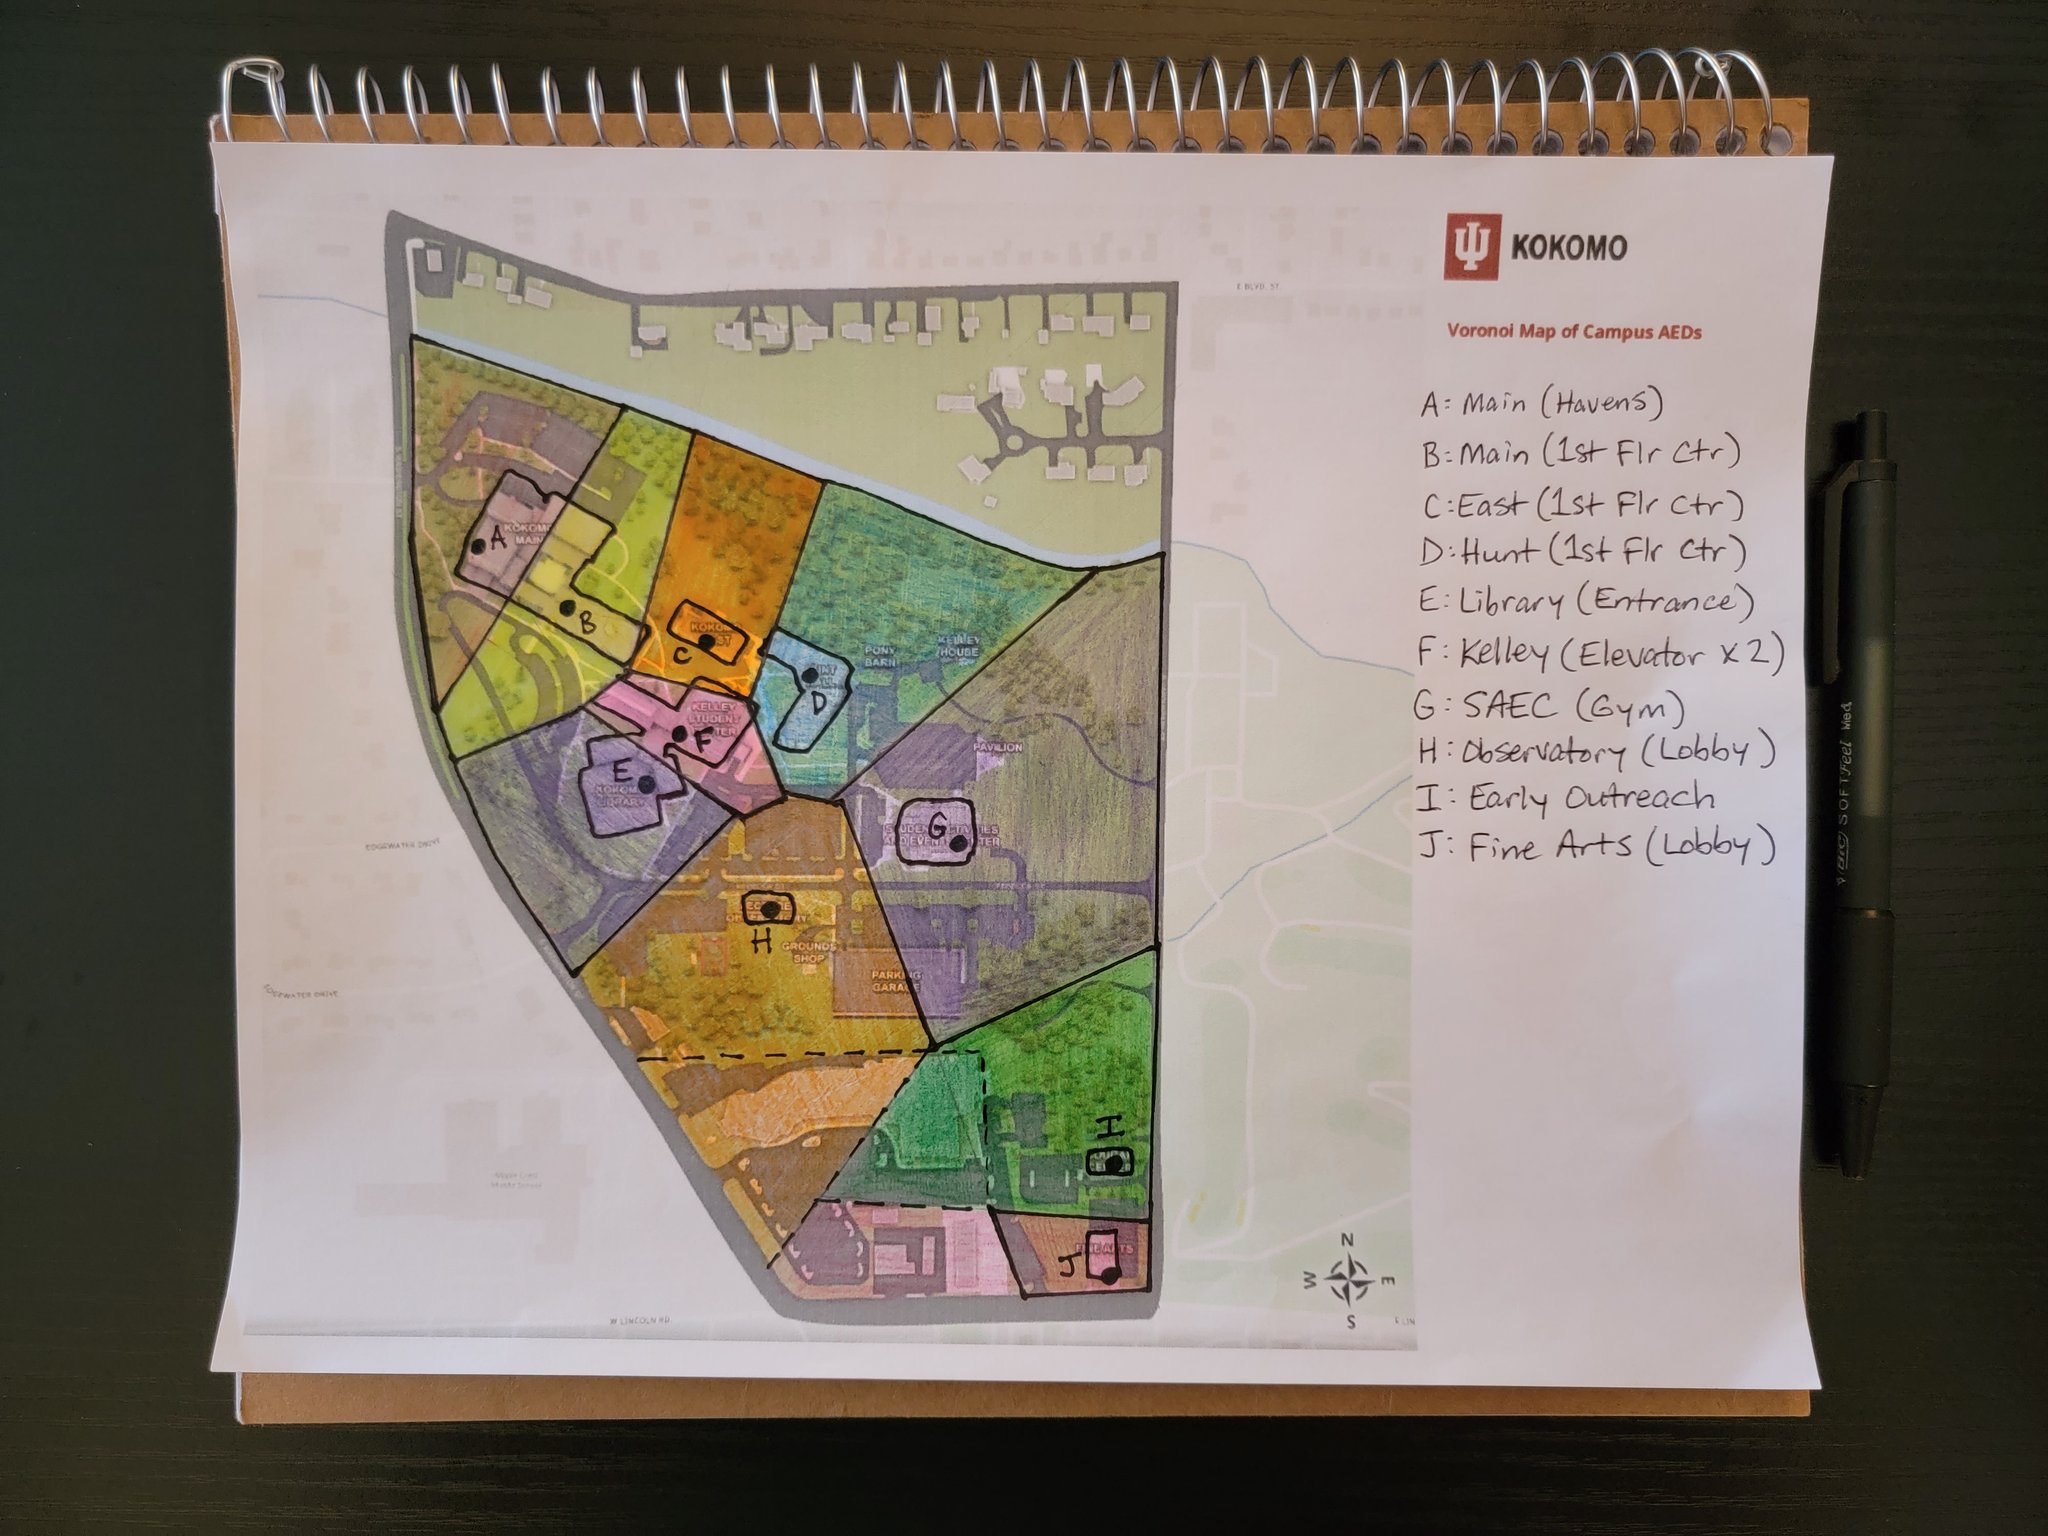
Figure 2. The hand-drawn test map used ruler measurements instead of plotted coordinates (own photo).
🚨 Addendum (5/23/2022) 🚨
There are now two AEDs on the first floor of the Kelley Center. The first (point F in Figure 2) is next to an elevator that is across the hall from the campus bookstore. The second is behind an ATM (polygon intersection CDF in Figure 2). The location is mentioned here during Summer 2022 to inform the public, but this project will not be updated to reflect new data points. Any future AED app should include all known AEDs at time of development and plan to scale with additional data.
Voronoi Diagram Applications
Blending art and science, Voronoi diagrams (named after mathematician Georgy Voronoy) grab attention with strange shapes and stained-glass colors. They can be used to solve a variety of scientific problems or, as described in the TV show Numb3rs, to locate the nearest restaurant. In urban planning, companies decide where to build the next franchise, hospital, bus stop, or cell tower by creating a Voronoi diagram and solving the largest empty circle problem. In Figure 2, polygon intersections DGH (a parking lot on campus) and GHI (a church building next to campus) could be sites for future AED placement.
Video (36 seconds): "The closest place to get a cheeseburger."
Thiessen Polygon Tools
The shapes that compose a Voronoi diagram are called Thiessen polygons (named after meteorologist Alfred H. Thiessen). Users with an ArcGIS advanced software license (including educational site licenses) can auto-calculate Thiessen polygons in ArcGIS Pro (with graphical tools and Python) and in ArcMap (with graphical tools and Python). There is even a Thiessen class in ArcObjects' Java API.
However, searching ArcGIS Runtime's Java API did not reveal any Thiessen polygon or Voronoi diagram resources. The author prefers a Voronoi map for visualizing AED coverage zones, so finding a way to display this map in ArcGIS Runtime became the technical focus of this project.
The solution was to create ten polygons that fit together like a puzzle. The amount of work required to calculate and display coordinates for each polygon is manually intensive, so this solution would be impractical for projects with more than ten data points.
Integrated Development Environment (IDE)
The author's Java instructor approved the exploration of ArcGIS Runtime's Java API as a semester project. ArcGIS is a suite of geographic information system (GIS) software developed by Esri. Using JetBrains IntelliJ IDEA (with a student license), coordinates of polygon vertices were extracted within a Maven project management build and the Voronoi map was constructed within a Gradle project management build.
The Forty-Year-Old Version
In order to construct ten individual polygons that fit together as a mathematically precise Voronoi puzzle, the latitude and longitude of every polygon corner (vertex) must be calculated. The author extracted these coordinates from third-party code that has been iterating online for 36 years:
- 1986: Steven Fortune published A Sweepline Algorithm for Voronoi Diagrams in C
- 2003: Shane O'Sullivan adapted Fortune's algorithm into C++
- 2007: Zhenyu Pan adapted O'Sullivan's version into a Java applet
- 2010: James Humphreys adapted Pan's applet into a Maven-based Java project (Simple Voronoi)
- 2022: Michael LaFleur adapted Humphreys' output to display vertices coordinates for pasting into ArcGIS Runtime
Input (Points) and Output (Polygons)
<dependency>
    <groupId>be.humphreys</groupId>
    <artifactId>simplevoronoi</artifactId>
    <version>0.2-SNAPSHOT</version>
</dependency>
Figure 3. The Maven dependency required by Simple Voronoi (code box).
After building the Maven framework and project dependency in IntelliJ IDEA, Simple Voronoi was loaded.
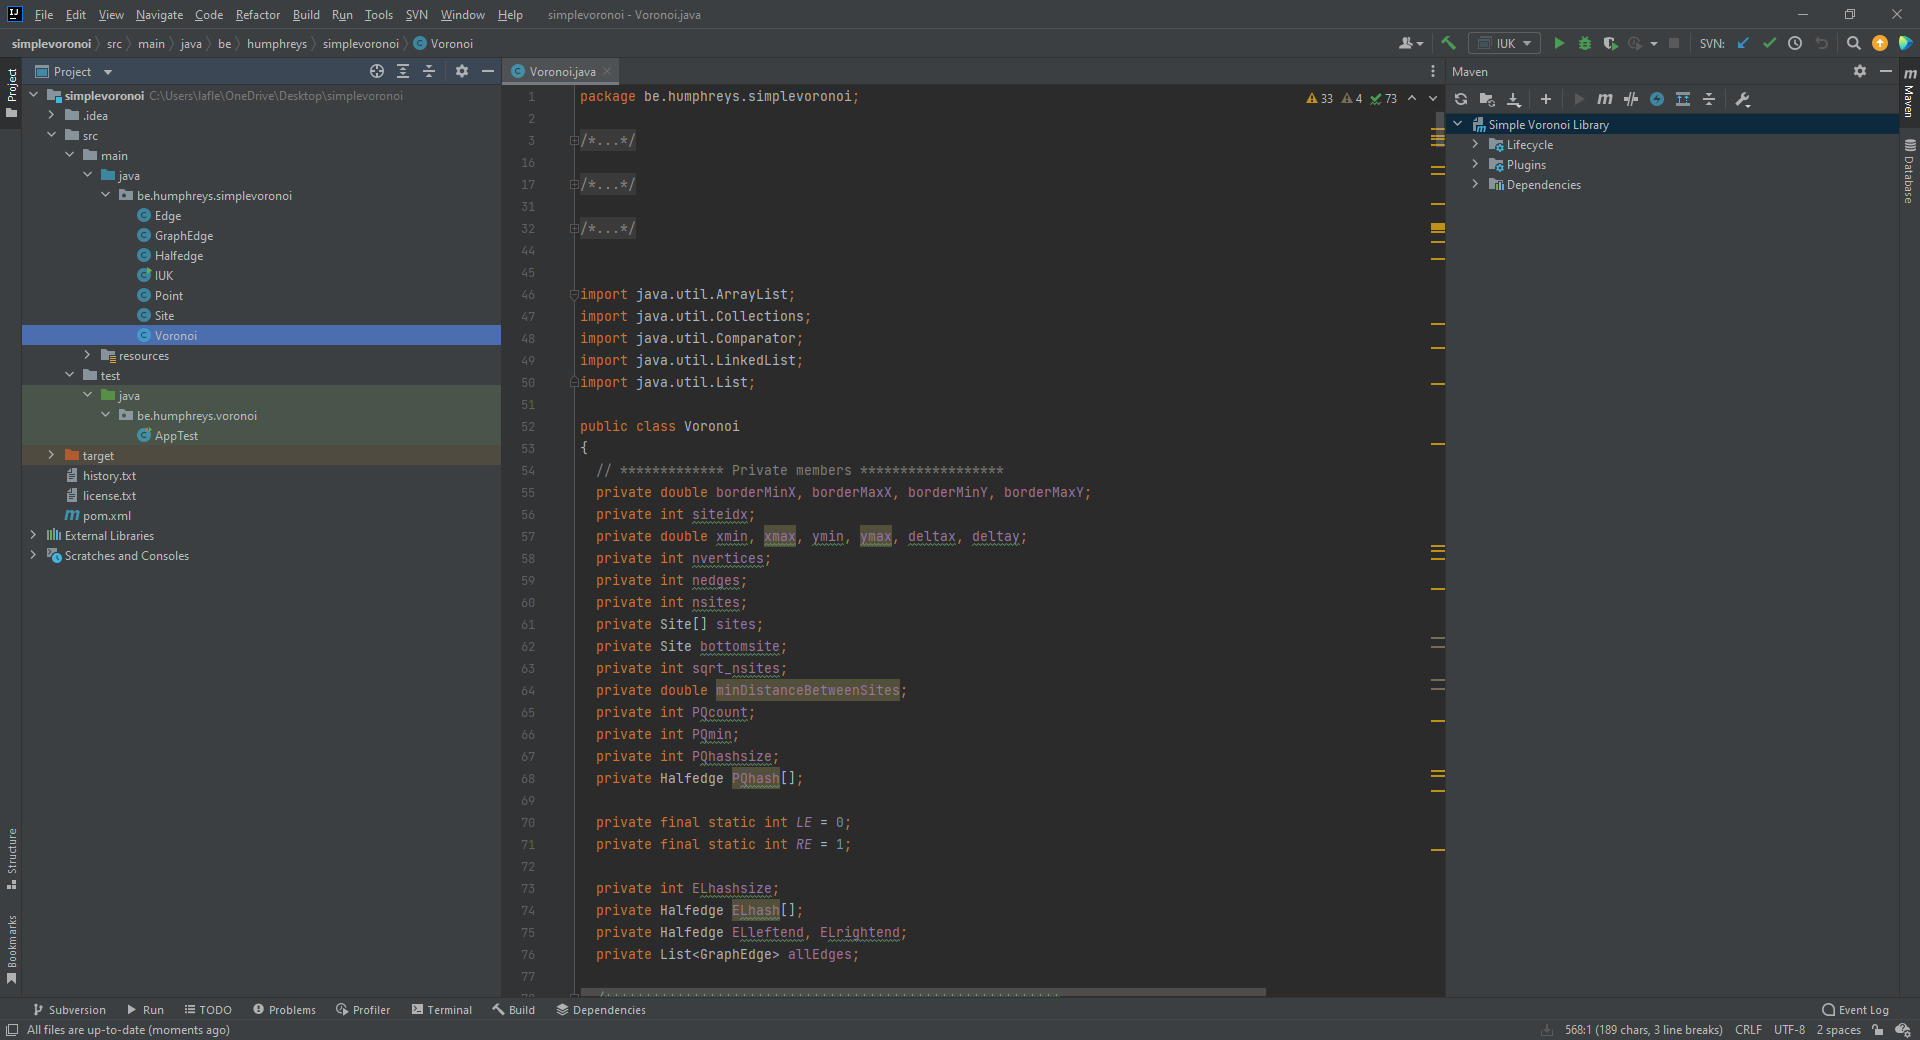
Figure 4. Simple Voronoi opened in IntelliJ IDEA (own photo).
There was a file to output calculations (Voronoi.java) but no obvious input file was found, so this author wrote one.
package be.humphreys.simplevoronoi;

import java.util.List;

public class IUK {
    public static void main(String[] args) {
        // Voronoi bounding box
        double minX = -86.1336966;
        double maxX = -86.1270345;
        double minY = 40.4552881;
        double maxY = 40.4621868;

        // AED latitude array
        double[] yValuesIn = new double[10];
        yValuesIn[0] = 40.45627; // Early Outreach
        yValuesIn[1] = 40.46000; // East
        yValuesIn[2] = 40.45546; // Fine Arts
        yValuesIn[3] = 40.45971; // Hunt
        yValuesIn[4] = 40.45923; // Kelley
        yValuesIn[5] = 40.45903; // Library
        yValuesIn[6] = 40.46020; // Main (central)
        yValuesIn[7] = 40.46048; // Main (Havens)
        yValuesIn[8] = 40.45803; // Observatory
        yValuesIn[9] = 40.45847; // SAEC

        // AED longitude array
        double[] xValuesIn = new double[10];
        xValuesIn[0] = -86.12740; // Early Outreach
        xValuesIn[1] = -86.13105; // East
        xValuesIn[2] = -86.12744; // Fine Arts
        xValuesIn[3] = -86.13014; // Hunt
        xValuesIn[4] = -86.13137; // Kelley
        xValuesIn[5] = -86.13148; // Library
        xValuesIn[6] = -86.13246; // Main (central)
        xValuesIn[7] = -86.13314; // Main (Havens)
        xValuesIn[8] = -86.13055; // Observatory
        xValuesIn[9] = -86.12869; // SAEC

        Voronoi v = new Voronoi(0.00001f);

        List allEdges = v.generateVoronoi(xValuesIn, yValuesIn, minX, maxX, minY, maxY);
    } // End method main
} // End class IUK
Figure 5. The file IUK.java input campus AED coordinates to Simple Voronoi (code box).
However, the output of Simple Voronoi was illegible.
be.humphreys.simplevoronoi.GraphEdge@568db2f2
be.humphreys.simplevoronoi.GraphEdge@378bf509
be.humphreys.simplevoronoi.GraphEdge@5fd0d5ae
be.humphreys.simplevoronoi.GraphEdge@2d98a335
be.humphreys.simplevoronoi.GraphEdge@16b98e56
be.humphreys.simplevoronoi.GraphEdge@7ef20235
be.humphreys.simplevoronoi.GraphEdge@27d6c5e0
be.humphreys.simplevoronoi.GraphEdge@4f3f5b24
be.humphreys.simplevoronoi.GraphEdge@15aeb7ab
be.humphreys.simplevoronoi.GraphEdge@7b23ec81
be.humphreys.simplevoronoi.GraphEdge@6acbcfc0
be.humphreys.simplevoronoi.GraphEdge@5f184fc6
be.humphreys.simplevoronoi.GraphEdge@3feba861
be.humphreys.simplevoronoi.GraphEdge@5b480cf9
be.humphreys.simplevoronoi.GraphEdge@6f496d9f
be.humphreys.simplevoronoi.GraphEdge@723279cf
be.humphreys.simplevoronoi.GraphEdge@10f87f48
be.humphreys.simplevoronoi.GraphEdge@b4c966a
be.humphreys.simplevoronoi.GraphEdge@2f4d3709
Figure 6. Simple Voronoi output defaults to package.class.object@hashcode format (code box).
After some trial and error with attempts to override a toString() method, Humphreys' instructions became clear: "There is no graphical display code in this. The input is simply a set of X/Y coordinates for each site. The output is a list of GraphEdges, which contain a start/end X/Y coordinate pair. Display is left to the coder."
Knowing that polygons would be drawn in ArcGIS Runtime, the author found where Simple Voronoi output was prepared and added code that displays each variable.
private void pushGraphEdge(Site leftSite, Site rightSite, double x1, double y1, double x2, double y2)
{
    GraphEdge newEdge = new GraphEdge();
    allEdges.add(newEdge);
    newEdge.x1 = x1;
    newEdge.y1 = y1;
    newEdge.x2 = x2;
    newEdge.y2 = y2;

    newEdge.site1 = leftSite.sitenbr;
    newEdge.site2 = rightSite.sitenbr;

    // ML: Added to display assigned values in console!
    System.out.printf("\nL site: %d R site: %d\n1: %f, %f\n2: %f, %f\n", leftSite.sitenbr, rightSite.sitenbr, x1, y1, x2, y2);
}
Figure 7. A single line of code, precisely placed, made the output of Voronoi.java legible (code box).
L site: 0 R site: 8   1: -86.129632, 40.455974   2: -86.129245, 40.456666
L site: 8 R site: 9   1: -86.129245, 40.456666   2: -86.129731, 40.458720
L site: 8 R site: 4   1: -86.130762, 40.458765   2: -86.130539, 40.458917
L site: 8 R site: 3   1: -86.130539, 40.458917   2: -86.129731, 40.458720
L site: 4 R site: 3   1: -86.130539, 40.458917   2: -86.130734, 40.459417
L site: 5 R site: 4   1: -86.132104, 40.459503   2: -86.130762, 40.458765
L site: 5 R site: 6   1: -86.133693, 40.458172   2: -86.132104, 40.459503
L site: 4 R site: 6   1: -86.132104, 40.459503   2: -86.131790, 40.459856
L site: 4 R site: 1   1: -86.131790, 40.459856   2: -86.130734, 40.459417
L site: 8 R site: 5   1: -86.133697, 40.456036   2: -86.130762, 40.458765
L site: 5 R site: 7   1: -86.133697, 40.458168   2: -86.133693, 40.458172
L site: 6 R site: 7   1: -86.133693, 40.458172   2: -86.132040, 40.462187
L site: 1 R site: 6   1: -86.131790, 40.459856   2: -86.131459, 40.462187
L site: 2 R site: 8   1: -86.130199, 40.455288   2: -86.129632, 40.455974
L site: 1 R site: 7   1: -86.131648, 40.462187   2: -86.131648, 40.462187
L site: 3 R site: 1   1: -86.130734, 40.459417   2: -86.129852, 40.462187
L site: 9 R site: 3   1: -86.129731, 40.458720   2: -86.127035, 40.461874
L site: 0 R site: 9   1: -86.129245, 40.456666   2: -86.127035, 40.457963
L site: 2 R site: 0   1: -86.129632, 40.455974   2: -86.127035, 40.455846
Figure 8. The updated output (reformatted for brevity) reveals coordinates of Thiessen polygon vertices that can be copied and pasted into other programs, such as ArcGIS Runtime for Java (code box).
More Data Validation
All acquired data gets validated, regardless of when that data was collected in the project timeline. The next step was to confirm that this is a list of Thiessen polygon vertices. That meant importing the vertices coordinates into ArcGIS Pro, running its built-in Thiessen spatial analysis tool, then comparing the results. This project now exists as a hand-drawn map, a command prompt program, an ArcGIS Runtime for Java file, and an ArcGIS Pro file.
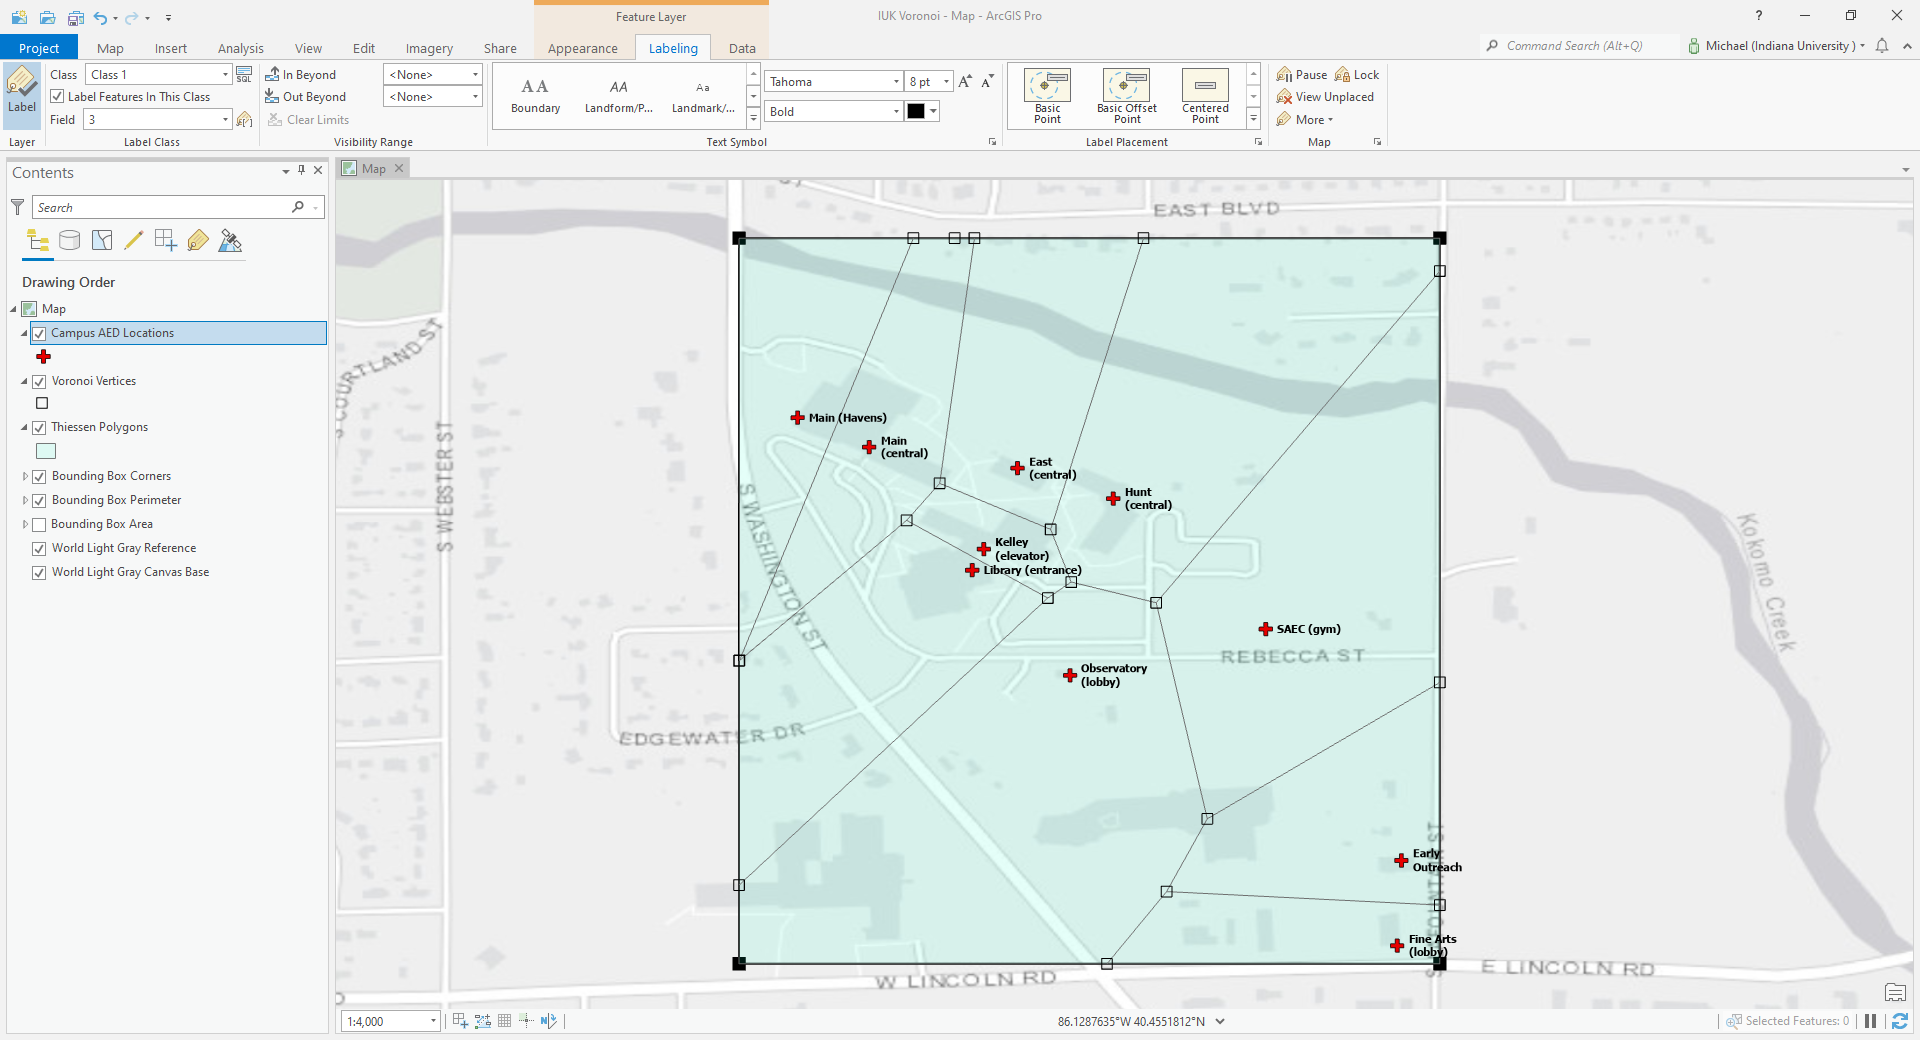
Figure 9. The imported vertices match auto-generated polygon intersections (own photo).
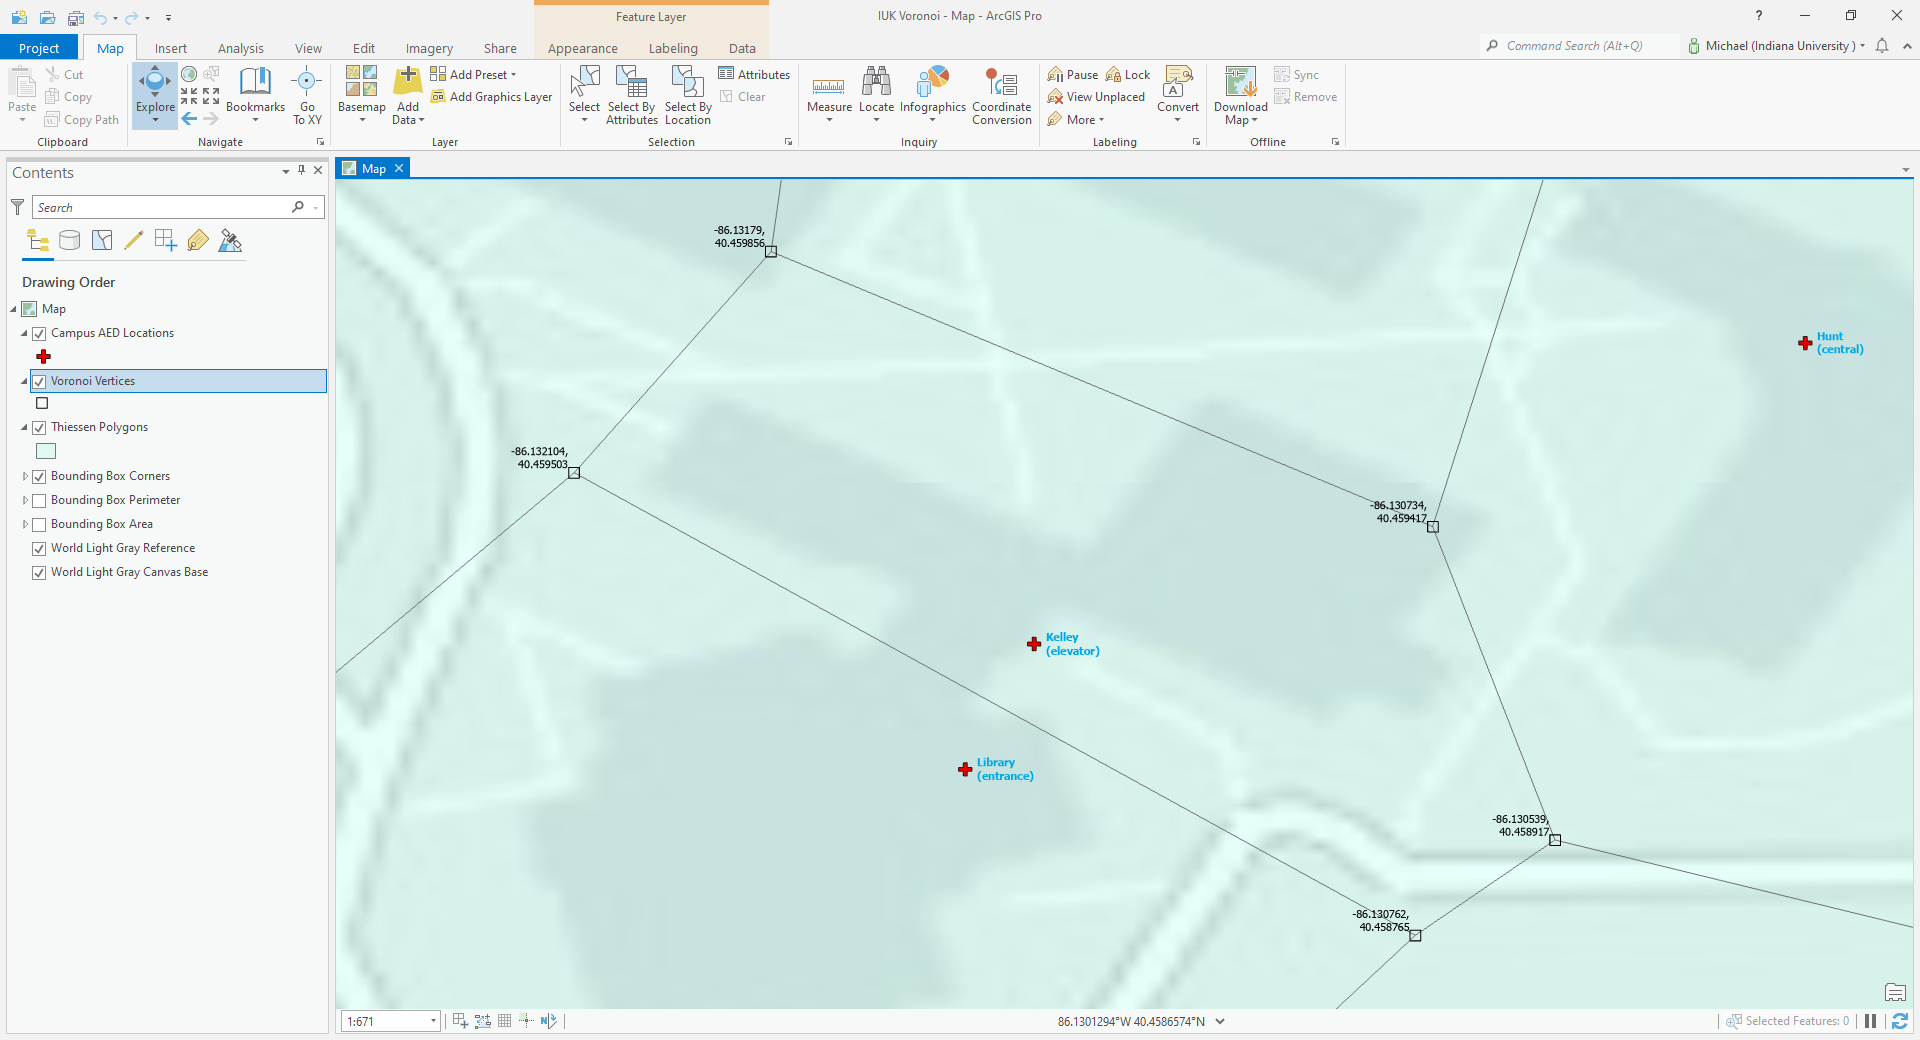
Figure 10. Zooming in along each edge confirmed that no vertex was missed (own photo).
Assembling the Polygon Puzzle
After all coordinates were verified, it was time to plot all ten polygons on the final map. ArcGIS Runtime has step-by-step tutorials for adding points (AEDs) and polygons (AED coverage zones) in the Java API.
This is where the solution should be limited to small projects with ten data points. Each point in Runtime has a coordinate, symbol, point graphic, polygon geometry, polygon graphic, and overlay. Each polygon in Runtime has a collection of point coordinates, fill symbol, polygon geometry, polygon graphic, and overlay. The code is lengthy and has been posted at https://github.com/mflaneur/aed-voronoi/blob/main/App.java with the author's API key redacted.
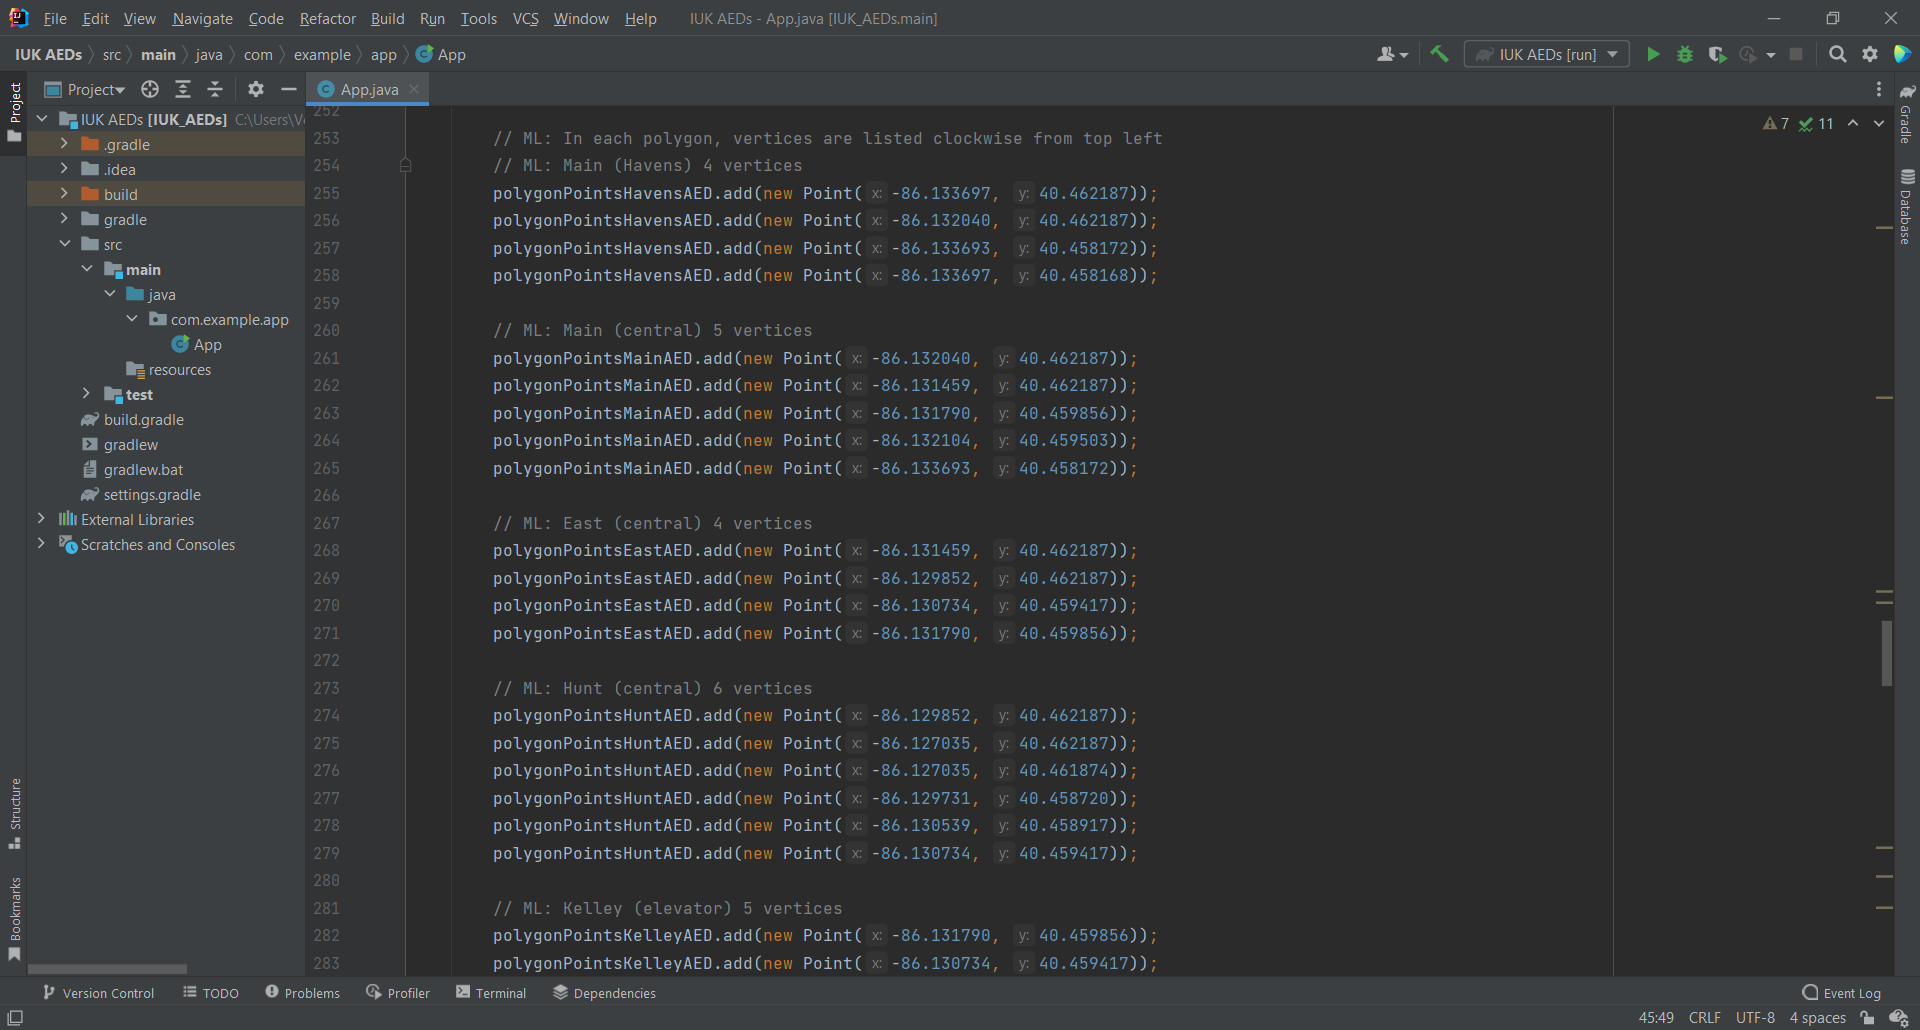
Figure 11. ArcGIS Runtime edited in IntelliJ IDEA (own photo).
Public Safety Recommendations
- As a retired paramedic who has witnessed numerous bystanders in distress, the author recommends that an AED locator app is simple and easy to use. The app should be focused on completing two tasks as quickly as possible: guiding a bystander to the nearest AED, then guiding both back to the person who needs help.
- Voronoi maps are a nice visual to increase AED awareness, but the author believes a distance sort that displays only the closest AED and highlights its route from the bystander's current GPS location would be more appropriate during emergencies. It is possible that geofencing could improve AED retrieval by displaying the AED photo on bystanders' phones when they enter the zone boundary or building.
- Indoor positioning systems (IPS) could supplement GPS to cover both indoor and outdoor tracking. Geofence and IPS features would need tested to ensure their implementation does not confuse bystanders or hinder AED retrieval.
- When an AED's power button is pressed, the AED will play step-by-step audio instructions for bystanders. However, the author recommends taking a CPR and AED course to prepare for emergencies. Part of caring for other people is learning how to use the tools that can help them... and knowing where those tools are located.
