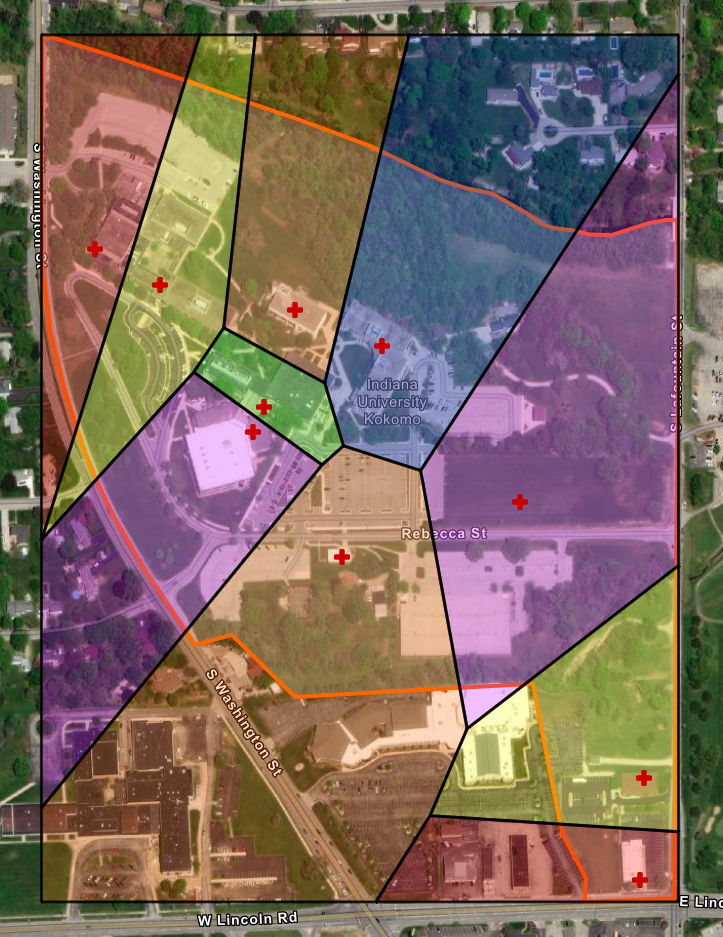
Campus AED Map:
Converting Coordinates, Calculating Haversine Distances, and Displaying a Grid With Java
Michael LaFleur
Informatics, Indiana University Kokomo
INFO-I 210: Information Infrastructure (Java 1)
Spring 2022
Abstract
The author received permission to explore ArcGIS Runtime Java API (addendum 4/6/23: name changed to ArcGIS Maps SDK for Java) in a semester project, but was concerned that student programming would be difficult to identify when mixed with a large quantity of auto-generated API framework code. In addition, students in the Java 1 course used text editors with syntax highlighting to write programs for command prompt compiling and execution. The author developed this project in a text editor before moving to ArcGIS for the graphical component. Four files were created to maintain organization and manage file length: MainMenu.java, DegreeConverter.java, DistanceCalculator.java, and GridMapper.java. All files were stored in the same directory and compiled with the command [ javac MainMenu.java ], then run with the command [ java MainMenu ]. Project code can be viewed at https://github.com/mflaneur/aed-java1 .
Project Data
Data collection, validation, and display concerns are discussed in the companion project Campus AED Map: Constructing a Voronoi Diagram From Thiessen Polygons With ArcGIS Runtime Java API. Ten automated external defibrillators (AEDs) on the Indiana University Kokomo campus were geotagged in person by the author using the SurveyCam Android app.
| Early Outreach: | 40.45627, -86.12740 |
| East: | 40.46000, -86.13105 |
| Fine Arts: | 40.45546, -86.12744 |
| Hunt: | 40.45971, -86.13014 |
| Kelley: | 40.45923, -86.13137 |
| Library: | 40.45903, -86.13148 |
| Main (central): | 40.46020, -86.13246 |
| Main (Havens): | 40.46048, -86.13314 |
| Observatory: | 40.45803, -86.13055 |
| SAEC: | 40.45847, -86.12869 |
Table 1. AED locations, latitudes, and longitudes.
MainMenu.java
File code can be viewed at https://github.com/mflaneur/aed-java1/blob/main/MainMenu.java . Menu options include: convert decimal degrees to DMS (degrees minutes seconds), convert DMS to decimal degrees, compute Haversine distance between coordinates, view grid map, view ArcGIS project URL, and exit.
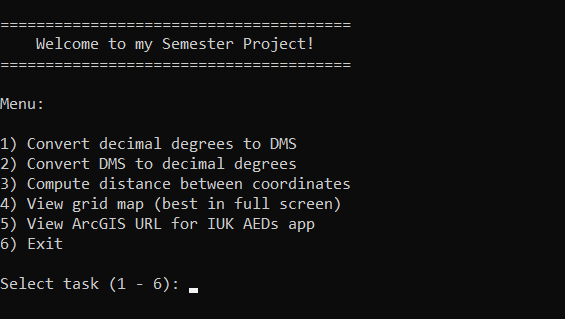
Figure 1. The main menu for the semester project (own photo).
DegreeConverter.java
File code can be viewed at https://github.com/mflaneur/aed-java1/blob/main/DegreeConverter.java . Note that prior to conversions, the main menu uses do-while loops to validate data input. Valid ranges and data examples are displayed in the prompt to make layperson use (and grading) easier.
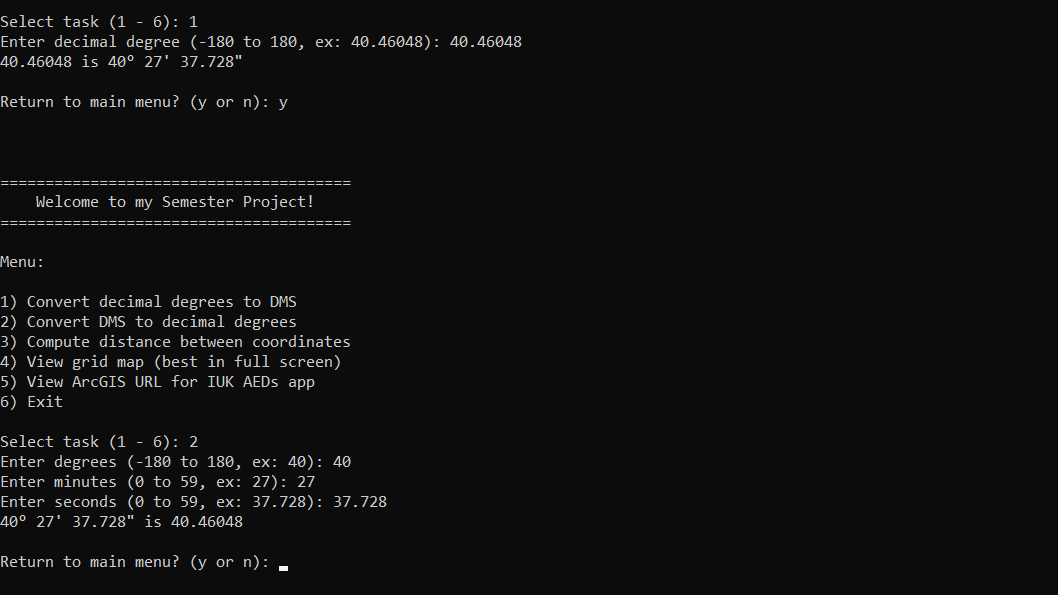
Figure 2. Conversions between decimal degrees and DMS notation (own photo).
DistanceCalculator.java
File code can be viewed at https://github.com/mflaneur/aed-java1/blob/main/DistanceCalculator.java . The author does not claim to be a mathematician. Several sources were consulted to calculate the Haversine distance between two points on a sphere and are documented in the code comments.
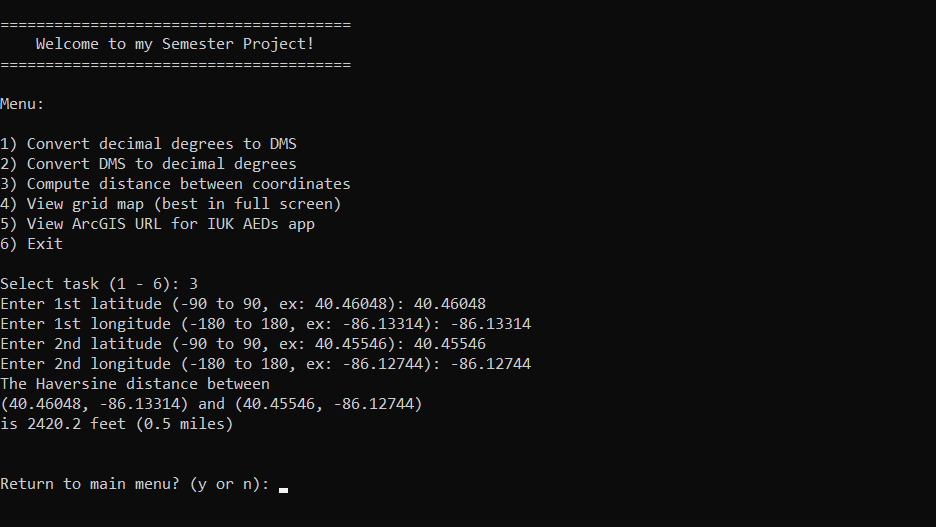
Figure 3. The Havens Auditorium AED is 0.5 miles from the Fine Arts Building AED (own photo).
GridMapper.java
File code can be viewed at https://github.com/mflaneur/aed-java1/blob/main/GridMapper.java . This grid uses a Cartesian coordinate system. Longitude is the x-axis value. Latitude is the y-axis value. The origin (0, 0) is where the Prime Meridian (x = 0) and the Equator (y = 0) meet (in the Gulf of Guinea). Because Indiana is northwest of this intersection (in Quadrant II), campus longitudes are negative while campus latitudes are positive.
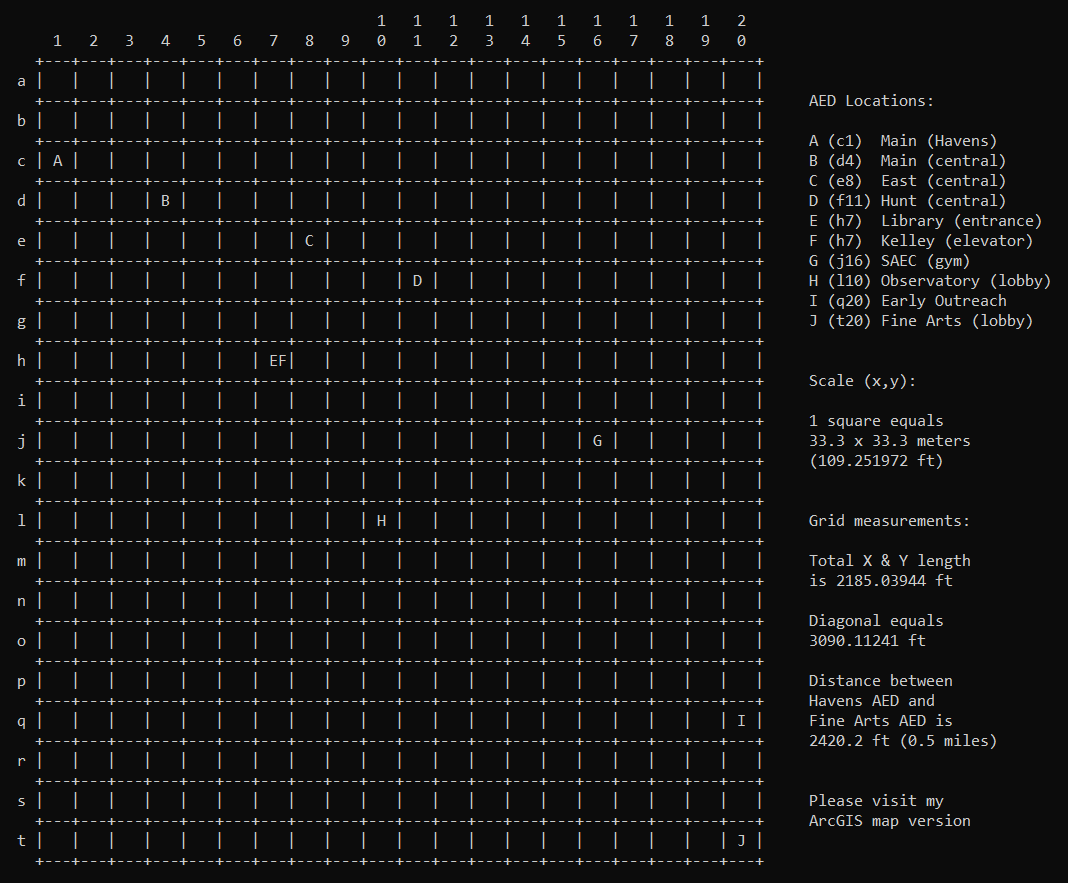
Figure 4. By assigning a step value to every line, AEDs were procedurally placed and labeled on a grid map.
The Dark Side of the Rainbow
Like a wave of color saturating The Wizard of Oz, the next phase of this project is a stained-glass puzzle. Note that AED locations match up between the grid map and the graphical map. In Campus AED Map: Constructing a Voronoi Diagram From Thiessen Polygons With ArcGIS Runtime Java API, the author inches closer toward making an AED app.
Figure 5. Thiessen polygons show campus AED coverage zones in ArcGIS Runtime (own photo).

